Recently I’ve been trying to help somebody whose spirometry results changed drastically depending on where their tests were performed. When their spirometry was performed on an office spirometer their FVC was less than 60% of predicted and when they were performed in a PFT lab on a multi-purpose test system their FVC was closer to 90% of predicted. Part of the reason for this was that different predicted equations are being used in each location but even so there was about a 1.5 liter difference in FVC.
One important clue is that the reports from the office spirometer showed an expiratory time of around 2 to 2-1/2 seconds while the reports from the PFT lab showed expiratory times from 9 to 12 seconds. The reports from both locations however, only had flow-volume loops and reported expiratory time numerically. There were no volume-time curves so it isn’t possible to verify that the spirometry being performed at either location was measuring time correctly or to say much about test quality.
The shape of a flow-volume loop is often quite diagnostic and many lung disorders are associated with very distinct and specific contours. Volume-time curves, on the other hand, are very old-school and are the original way that spirometry was recorded. The contours of volume-time curves are not terribly diagnostic or distinctive and I suspect they are often included as a report option more because of tradition than any thing else. But volume-time curves are actually a critically important tool for assessing the quality of spirometry and one of the most important reasons for this is because there is no time in a flow-volume loop.
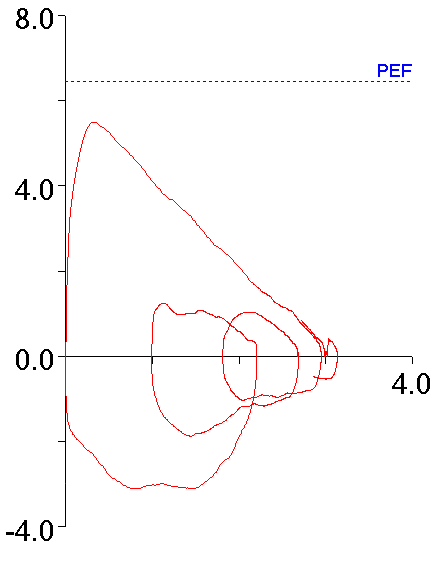
With this in mind, the following flow-volume loop came across my desk yesterday. The FVC, FEV1 and FEV1/FVC ratio were all normal and it was the best of the patient’s efforts.
The contour of this flow-volume loop is actually reasonably normal, except possibly for the little blip at the end.
Continue reading

