Thinking about the past

This is the time of the year when it’s traditional to review the past. That’s what “Auld lang syne”, the song most associated with New Year’s celebrations, is all about. I too have been thinking about the past but it’s not been about absent friends, it’s been about trend reports and assessing trends.

In the May 2017 issue of Chest, Quanjer et al reported their study on the post-bronchodilator response in FEV1. I’ve discussed this previously and they noted that the current ATS/ERS standard for a significant post-bronchodilator change of ≥12% and ≥200 ml penalized the short and the elderly. Their finding was that a significant change was better assessed by the absolute change in percent predicted (i.e. 8%) rather than a relative change.

I’ve thought about how this could apply to assessing changes in trends ever since then. The current standards for a significant change in FEV1 over time (also discussed previously) is anything greater than:

which is good in that it is a way to reference changes over any arbitrary time period but it also looks at it as a relative change (i.e. ±15%). A 15% change however, comes from occupational spirometry, not clinical spirometry, and the presumption, to me at least, is that it’s geared towards individuals who have more-or-less normal spirometry to begin with.

A ±15% change may make sense if your FEV1 is already near 100% of predicted but there are some problems with this for individuals who aren’t. For example, a 75 year-old 175 cm Caucasian male would have a predicted FEV1 of 2.93 L from the NHANESIII reference equations. If this individual had severe COPD and an FEV1 of 0.50 L (17% of predicted), then a ±15% relative change in FEV1 would ±0.075 L (75 ml). That amount of change is half the acceptable amount of intrasession repeatability (150 ml) in spirometry testing and it’s hard to consider a change this small as anything but chance or noise. It’s also hard to consider this a clinically significant change. Continue reading

Why the FEV1/FVC ratio LLN as a percent of the predicted FEV1/FVC ratio is important

My medical director and I had a discussion today about where the cutoff for a normal FEV1/FVC ratio would be for a 93 year old patient of his. Part of the problem is that there are almost no reference equations for patients this age and the best you can usually do is to extrapolate. Another part is that anybody in their 90’s is a survivor and must have had good lung function throughout their life to reach that age, which means that they aren’t average so it’s not clear how well extrapolation actually works in this population. The final part is that the guidelines for PFT interpretation that are used by my lab were put into place about 40 years ago and reflect the thoughts at that time. I updated part of the guidelines with the 2005 ATS/ERS interpretation algorithm about 10 years ago, but the thresholds for normalcy (as well as the reference equations we use) still haven’t changed all that much. I’ve brought this issue up a number of times over the years (usually every time I get a new medical director) but haven’t gotten a consensus from the pulmonary physicians on either the need for change or for what threshold values should be used.

Anyway, both my medical director and I felt felt that the LLN for the FEV1/FVC ratio (when viewed as a percent of the predicted FEV1/FVC ratio) is probably lower for a 75 year old (and certainly for a 93 year old) than it is for a 25 year old, and that the current lab guidelines for interpretation were probably diagnosing airway obstruction in the elderly more often than they should. My lab currently uses the NHANESIII reference equations for spirometry however, and I wasn’t sure they showed this particularly well since the equations for the FEV1/FVC ratio and its LLN are quite simplistic compared to those for FVC and FEV1.

The NHANESIII reference equations were published in 1999 and at that time they were derived from the largest population that had ever been studied (7428 subjects, 40.9% male, 59.1% female) and with the most sophisticated statistical analysis that had been used up until that time. In 2012 however, the Global Lung Function Initiative (GLI) released a set of reference equations using data obtained from 73 centers world-wide on 97,759 subjects (44.7% male, 55.3% female). Statistical analysis of the GLI data was performed using the Lambda, Mu, Sigma (LMS) approach and a set of equations were derived that covered ages 3 to 95.

I have some reservations about how well the GLI equations match the population served by my lab but it’s a moot point whether I like them or not since even now, 5 years after the GLI equations were published, my lab’s software has not been updated to include them. The reason for this is that the GLI spirometry equations use what are called “splines” to generate the spirometry reference values and these are taken from a look-up table. My lab’s software does have an equation editor but it will not accommodate lookup tables so the GLI equations can’t be added. I’m sure our equipment manufacturer could get around this if they really wanted to, but so far it hasn’t happened.

I do have a lot of respect for the GLI equations however, and think that the overall view they give of the normal distribution of FVC, FEV1 and the FEV1/FVC ratio is far more correct than those of any prior studies. Using a spreadsheet tool downloaded from the GLI that lets me generate the GLI spirometry predicted values and the NHANESIII reference equations I decided to take a closer look at their predicted FEV1/FVC ratios and their LLNs.

Continue reading

Contraindications

A couple weeks ago I was asked whether it was safe for a patient with an abdominal aortic aneurysm (AAA) to have pulmonary function testing. My first thought was that it was probably unsafe but after a moment or two of thought I realized that I hadn’t reviewed the subject for a long time. When I checked the 2005 ATS/ERS general testing guidelines (there are no contraindications in the 2005 spirometry guidelines) I found that AAA wasn’t mentioned at all. In fact, the only absolute contraindication mentioned was that patients with a recent myocardial infarction (<1 month) should not be tested. Some relative contraindications were mentioned:

  • chest or abdominal pain
  • oral or facial pain
  • stress incontinence
  • dementia or confusional state

and activities that should be avoided prior to testing include:

  • smoking within 1 hour of testing
  • consuming alcohol within 4 hours of testing
  • performing vigorous exercise within 30 minutes of testing
  • wearing clothing that restricts the chest or abdomen
  • eating a large meal with 2 hours of testing

but these were factors where test results were likely to be suboptimal and not actually contraindications.

This got me curious since I thought that pulmonary function testing was contraindicated for more conditions than just an MI. I reviewed the 1994 and and then the 1987 ATS statements on spirometry but again found no mention of contraindications. Ditto on the 1993 ERS statement on spirometry and lung volumes. Finally, in the 1996 AARC clinical guidelines for spirometry I found a much longer list of contraindications:

  • hemoptysis of unknown origin
  • pneumothorax
  • recent mycardial infarction
  • recent pulmonary embolus
  • thoracic, abdominal or cerebral aneuysms
  • recent eye surgery
  • presence of an acute disease process that might interfere with test performance (e.g. nausea, vomiting)
  • recent surgery of thorax or abdomen

So where did the AARC’s list of contraindications come from? And why is there such a discrepancy between the ATS/ERS and the AARC guidelines?

Continue reading

Assessing post-BD improvement in FEV1 and FVC as a percent of the predicted

The 2005 ATS/ERS standards for assessing post-bronchodilator changes in FVC and FEV1 have been criticized numerous times. A recent article in the May issue of Chest (Quanjer et al) has taken it to task on two specific points:

  • the change in FVC and FEV1 has to be at least 200 ml
  • the change is assessed based on the percent change (≥12%) from the baseline value

The article points out that the 200 ml minimum change requires a proportionally larger change for a positive bronchodilator response in the short and the elderly. Additionally, by basing the post-BD change on the baseline value it lowers the threshold (in terms of an absolute change) for a positive bronchodilator response as airway obstruction become more severe. As a way of mitigating these problems the article recommends looking at the post-bronchodilator change as a percent of predicted rather than as a percent of baseline.

The article is notable (and its authors are to be commended) because it studied 31,528 pre- and post-spirometry records from both clinical and epidemiological sources from around the world. For the post-bronchodilator FEV1 and FVC:

  • the actual change in L
  • the percent change from baseline
  • the change in percentage of predicted
  • the Z-score

were determined.

Continue reading

Is there such a thing as a normal decrease when the FEV1 isn’t normal?

I’ve mentioned before that my lab’s database goes back to 1990, so we now have 27 years of test results available for trending. At least a couple times a week we have a patient who was last seen 10 or even 20 years ago. When I review their results I try to see if there has been any significant change from their last tests. Since the last tests are often quite some time in the past the changes in an absolute sense are often noticeably large. The question then becomes whether or not these changes are normal.

Although the ATS/ERS, NIOSH and ACOEM standards for spirometry address changes over time they don’t specifically discuss changes over a decade or longer. Instead, without indicating a time period (other than saying a year or more), the concensus is that a change greater than 15% in age-adjusted FVC or FEV1 is likely to be significant. A change in absolute values greater than:

Or if the current FEV1 is less than:

Then the change is likely significant.

This sounds fairly reasonable and although we could quibble about the importance of how quickly or slowly this age-adjusted 15% change occurs and how well it applies when the patient’s latest age is beyond the reference equation’s study population (we have a fair number of 90+ year old patients nowadays) or when it’s across a developmental threshold (adolescent to adult), it’s still a good starting point.

I’ve been more or less following these rules for the last several years, when the results for a patient whose last test was 18 years ago came across my desk. The FEV1 from the current spirometry was 71% of predicted and the FEV1 from 18 years ago was 70% of predicted. Strictly speaking the absolute change was about -15% (the FEV1 was 2.06 L in 1999 and 1.76 L in 2017, a 0.30 L change) but when adjusted for the change in age, that’s only 40% what a significant change would need to be:

Given that the FEV1 percent predicted from both the older and newer test were essentially identical I automatically started to type “The change in FEV1 is normal for the change in age” when it suddenly occurred to me that neither FEV1 was normal in the first place so how could I be sure the change be normal?

Continue reading

When is it an expiratory plateau?

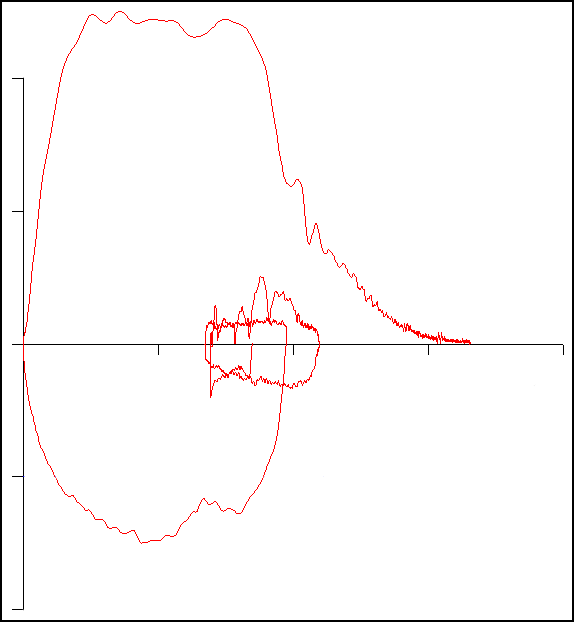
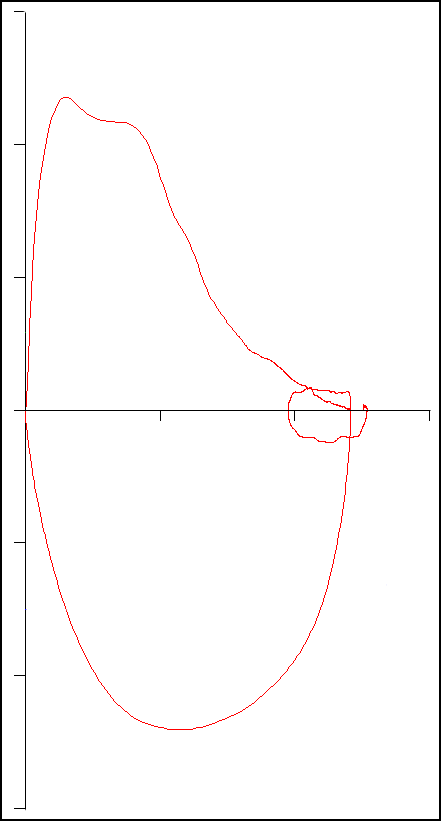
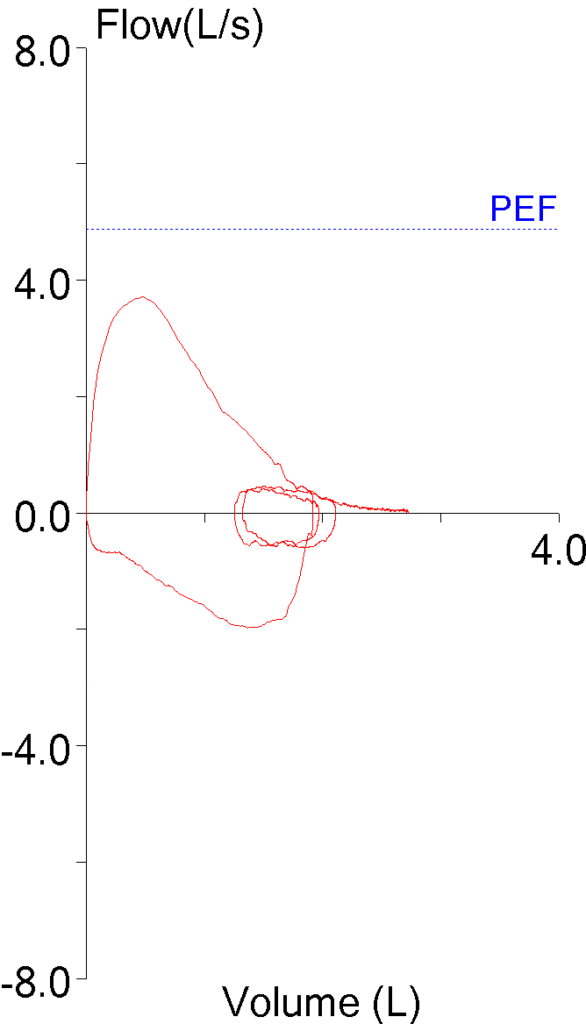
Over the last couple of weeks I’ve had an unusual number of patients with expiratory plateaus on their flow-volume loops. Expiratory plateaus are usually considered to be a sign of an intrathoracic central or upper airway obstruction and several of these patients had a diagnosis of tracheomalacia but many of them didn’t. Expiratory (and inspiratory) plateaus are mentioned in the ATS/ERS standards for interpretation but since there isn’t a specific definition (other than “plateau”), an expiratory plateau is a “know it when you see it” sort of thing.

The word plateau tends to imply that the flow-volume loop is both flat and level. Most textbook examples of an expiratory plateau tend to show a flow-volume loop that has been perfectly truncated, usually something like this:

or this:

but it usually isn’t that simple. An expiratory plateau is a consequence of a flow limitation, but during a forced exhalation the diameter of the airways decreases as the lung volume decreases from TLC towards RV. Depending on what is causing the flow limitation the plateau isn’t necessarily flat or level.

Continue reading

Normal or obstruction?

I had finished reviewing a pre- and post-BD spirometry report yesterday and was about to toss it on my out pile when I noticed something a bit odd about the post-BD results. I pulled it back and spent some time trying to decide if the interpretation needed to be changed but after a lot of internal debate I finally let it go as it was. I’ve continued to think about it however, and although I’m not sure that was the right decision I still haven’t come up with a clear answer.

Here’s what I saw:

Observed: %Predicted: Post-BD: %Predicted: %Change:
FVC: 3.70 97% 3.91 103% +6%
FEV1: 2.82 94% 2.79 93% -1%
FEV1/FVC: 76 95% 71 89% -6%
PEF: 6.62 94% 7.19 102% +9%
Exp. Time: 10.92 11.15

The reported pre-BD and post-BD results were from good quality tests and met the criteria for repeatability. My problem is that the baseline results were normal but if I had seen the post-BD results by themselves I would have considered them to show mild airway obstruction.

Continue reading

Which time is it?

The ATS/ERS standard for spirometry recommends reporting the highest FEV1 and the highest FVC even when they come from different tests. Our lab software allows us to do this, but only with some annoying limitations. One of the bigger limitations has to do with how expiratory time is reported. In particular, expiratory time is lumped in with a number of other values like Peak Flow (PEF) and FEF25-75. As importantly, the flow-volume loop and volume-time curve can only come from a single effort.

Our lab software defaults to choosing a single effort with the highest combined FVC+FEV1. The technician performing the tests will override this when other spirometry efforts have a larger FVC or a better FEV1 (which is chosen not just if it is higher but also on the basis of peak flow, back-extrapolation and other quality indicators). The usual order for this is to first choose a spirometry effort with the “best” FEV1, then if there is a different effort with a larger FVC that FVC is selected for reporting. When things are done this way what happens is that the expiratory time, flow-volume loop and volume-time curve that come from the effort selected for its FEV1 are reported. This means is that the expiratory time and volume-time curve often don’t match the reported FVC.

I always take a look at the raw test data whenever a spirometry report comes across my desk with an expiratory time less than 6 seconds or the technician noted that the spirometry effort is a composite. What I often find is that even though the reported expiratory time may be low, the FVC actually comes from an effort with an adequate expiratory time. Although I can select the right expiratory time the problem is that doing so also selects the PEF and the PEF from the effort with the highest FVC is often significantly less than the effort from the best FEV1. The same problem applies to selecting the volume-time curve since the associated flow-volume loop often doesn’t match the effort with the best FEV1 and best PEF. For these reasons I only select the correct expiratory time and volume-time curve when it doesn’t really affect the flow-volume loop and PEF.

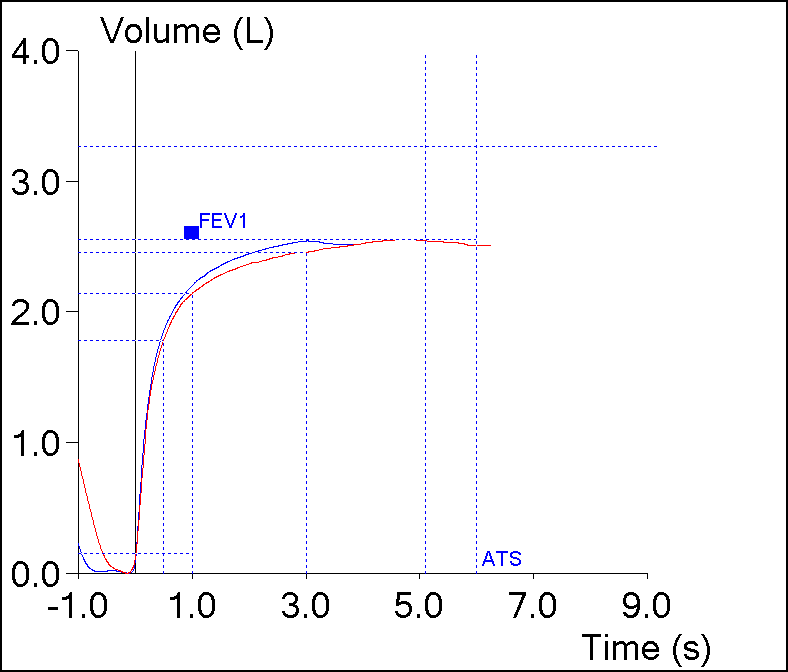
However, I’ve always assumed that the expiratory time from the effort with the highest FVC was probably the most correct expiratory time. Yesterday however, this spirometry effort came across my desk:

Blue Red
FVC: 2.53 2.54
FEV1: 2.19 2.13
FEV1/FVC: 86 84
PEF: 6.94 5.07
Exp. Time: 3.05 5.09

Continue reading

Is there airway obstruction when the FEV1 is normal?

I’ve been reviewing the literature on PFT interpretation lately and in doing so I ran across one of the issues that’s bothered me for a while. Specifically, my lab has been tasked with following the 2005 ATS/ERS guidelines for interpretation and using this algorithm these results:

Observed: %Predicted: LLN: Predicted:
FVC: 2.83 120% 1.76 2.36
FEV1: 1.77 100% 1.26 1.76
FEV1/FVC: 63 84% 65 75

would be read as mild airway obstruction.

Although it’s seems odd to have to call a normal FEV1 as obstruction I’ve been mostly okay with this since my lab has a number of patients with asthma whose best FVC and FEV1 obtained at some point in the past were 120% of predicted or greater but whose FEV1 frequently declines to 90% or 100% of predicted. In these cases since prior studies showed a normal FEV1/FVC ratio then an interpretation of a mild OVD is probably correct even though the FEV1 itself is well above the LLN, and this is actually the situation for this example.
Continue reading

Estimated Lung Age (ELA)

Cigarette smoking raises the probability that an individual will get lung cancer, chronic bronchitis and/or emphysema (among many other things). Nicotine is addictive and smokers often need significant motivation in order to quit. Lung age is a tool that was designed to give smokers an additional incentive to do this. The concept is fairly simple and that is by reformulating an FEV1 reference equation it is possible to take an individual’s actual FEV1 and estimate the age of their lungs (ELA). Because cigarette smoking can cause airway obstruction it tends to mimic premature lung aging which means that when a smoker’s FEV1 is used to calculate an ELA it can be significantly greater than their real or chronological lung age (CLA).

This idea was first proposed by Morris and Temple in 1985. Using Morris et al’s 1971 spirometry reference equations they studied the effect of calculating an estimated lung age (ELA) using observed FVC, FEV1 and FEF25-75 values both singly and in combinations and found that the FEV1 had the lowest standard error. The ELA calculation based on Morris et al’s FEV1 reference equations has achieved a degree of popularity and is available on at least one personal spirometer (Pulmolife, sold by Carefusion, MDSpiro and Vitalograph) and as an on-line calculator from a couple different websites (Chestx-ray.com and Lung Foundation of Australia).

Interestingly, the effectiveness of ELA towards quitting smoking has been studied only a handful of times. One often-quoted study of smoking cessation (Parkes et al) saw double the quit rate (13.6% vs 6.4%) when ELA was used as an intervention but the study’s methodology has since been criticized and it’s results have not been duplicated.

Continue reading