Have you checked the math on your reports lately?

Once again my lab was questioned by a research study’s primary investigator and study coordinator about why our lung volume results came out significantly lower than another lab’s. In order to be part of this study a subject has to have an RV that is greater than 150% of predicted. The RV we had obtained on a subject referred to the study was over a liter less than the results they had brought with them from another lab and for this reason the patient no longer qualified.

When I reviewed the subject’s test data from my lab it was clear to me that our test quality was good and more than met the ATS/ERS reproducibility criteria. We were given a copy of the subject’s report from the other lab and at first glance, the results look very typical for emphysema. Specifically the report showed very severe airway obstruction, a normal TLC, an elevated FRC and RV consistent with hyperinflation and a severely reduced DLCO. Our results however, showed a mixed defect with severe obstruction and a mildly reduced TLC.

Getting accurate lung volume measurements is hard. Regardless of which measurement technique you use, in most instances any errors tend to cause lung volumes to be overestimated. When very severe airway obstruction is present unless you are careful about panting frequency, plethysmography will often overestimate FRC and TLC, and that may be what happened in this case.

But this isn’t about test quality or the reasons why I believe my lab is better than most others. Although the report was from a nearby hospital with a reputation for the quality of its patient care, when I started reviewing it I immediately started to see math errors among the predicted values. I’ve run across these kind of errors before but this report was from a different equipment manufacturer than last time and this means that these kind of errors are probably far more common than I ever would have expected.

Continue reading

Using DL/VA (no, no, no, it’s really KCO!) to assess PFT results

Last week I was discussing the use of DL/VA to differentiate between the different causes of gas exchange defects with a physician. DL/VA is DLCO divided by the alveolar volume (VA). It is an often misunderstood value and the most frequent misconception is that it is a way to determine the amount of diffusing capacity per unit of lung volume (and therefore a way to “adjust” DLCO for lung volume). This is not the case because dividing DLCO by VA actually cancels VA out of the DLCO calculation and for this reason it is actually an index of the rate at which carbon monoxide disappears during breath-holding.

[Note: The value calculated from DLCO/VA is related to Krogh’s constant, K, and for this reason DL/VA is also known as KCO. The term DL/VA is misleading since the presence of ‘VA’ implies that DL/VA is related to a lung volume when in fact there is no volume involved. The use of the term DL/VA is probably a major contributor to the confusion surrounding this subject and for this reason it really should be banned and KCO substituted instead.]

I’ve written on this subject previously but based on several conversations I’ve had since then I don’t think the basic concepts are as clear as they should be.

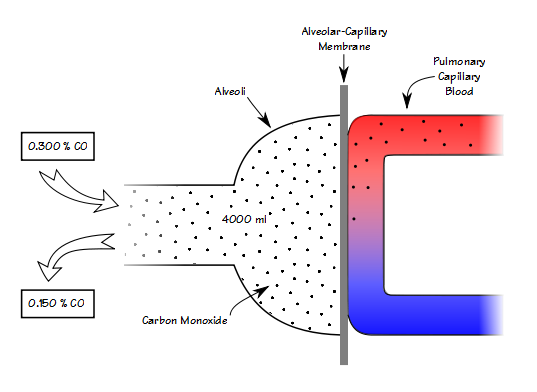
DLCO_Model

When you know the volume of the lung that you’re measuring, then knowing the breath-holding time and the inspired and expired carbon monoxide concentrations allows you to calculate DLCO in ml/min/mmHg.  When you remove the volume of the lung from the equation however (which is what happens when you divide DLCO by VA), all you can measure is how quickly carbon monoxide decreases during breath-holding (KCO). 
Continue reading

Selecting the best FEF25-75. Or not.

Oddly enough, I recently got a couple emails on the same day about the FEF25-75 and ended up corresponding for a while with the authors. FEF25-75 is a subject that somehow manages to keep resurrecting itself no matter how many stakes have gotten hammered into its heart. My opinion (expressed previously), and those of many others, is that the measurement of FEF25-75 is overly affected by FVC volume and expiratory time; that its reproducibility is poor; that its “normal” range is too broad to be meaningful; and that the FEF25-75 is usually only abnormal when the FEV1 is also below the LLN. Despite all this the FEF25-75 still continues to be used by many clinicians and researchers.

While discussing it however, one of the points that came up was how the “best” FEF25-75 should be selected. Given that it’s not clear to me exactly what the FEF25-75 is measuring, I am not sure there is such a thing as a “best” FEF25-75. Out of curiosity I reviewed a number of the older studies concerning FEF25-75 and although all the studies stated that their subjects performed multiple spirometry efforts I was interested to note that the FEF25-75 selection process was rarely, if ever, detailed. Of the exceptions, one stated the FEF25-75 was taken from the spirometry effort with the best FEV1 and another stated that the FEF25-75 was averaged from three efforts. The ATS/ERS statement on spirometry says that the FEF25-75:

“… is taken from the blow with the largest sum of FEV1 and FVC.”

This makes a certain amount of sense but because this statement is not referenced to any studies it should only be taken as a way to standardize the measurement of the FEF25-75 and not as a resolution about what constitutes the “best” FEF25-75. Even so it still leaves the door open to some varied interpretations. There are at least two situations where this is problematic. First, when two spirometry efforts have the same combined FVC + FEV1 value, and second, when an individual’s spirometry efforts are highly variable and the FVC and FEV1 have to be selected from separate efforts.

I didn’t have to go very far to find examples for both of these problems.

Continue reading

Hyperoxic CPETs

In patients with lung disease the use of supplemental oxygen during exercise increases oxygen consumption, endurance time and maximum workload, and decreases the sensation of dyspnea without increasing minute ventilation and maximum heart rate. My lab is occasionally asked to perform a CPET with an elevated FIO2 (hyperoxic CPET). We are capable of doing this but I’ve always had reservations, partly about the logistics involved in performing the CPET but more importantly with the interpretation of the results.

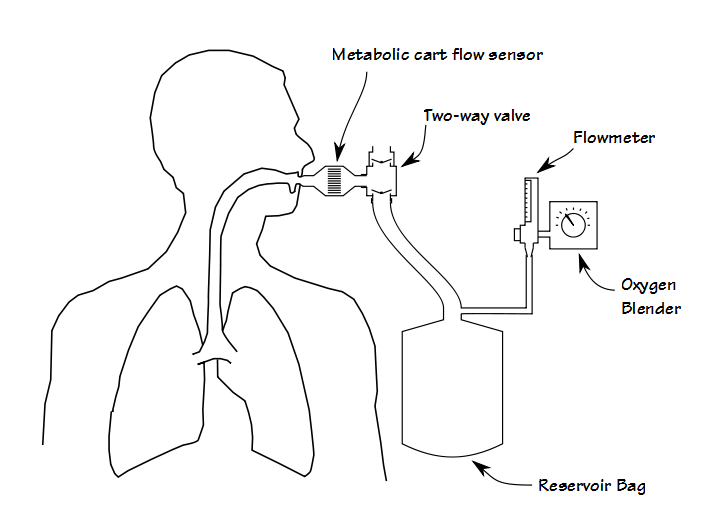
First, although it is certainly possible to perform some kinds of exercise test while the patient gets oxygen via a nasal cannula or mask, adding oxygen during a CPET requires that the patient breathes a hyperoxic gas mixture through their mouthpiece. Most commonly this is done by adding a two-way valve to the test system that is in turn attached to a reservoir bag which is filled from an oxygen blender.

CPET_Oxygen

Although functional, this adds extra dead-space and the valves add extra resistance, both of which increases the patient’s work of breathing. From a practical standpoint it also adds a fair amount of extra weight to the breathing manifold, often more than is comfortable for the patient. This means that some method for supporting the manifold must also put in place. About 25 years ago I performed CPETs using a treadmill that had a support arm and at that time the approach recommended by the equipment manufacturer was to suspend the breathing manifold using rubber tubing. This worked in that it supported the weight of the breathing manifold, but it didn’t do anything about its mass or inertia and when a patient transitioned from a walk to a jog, the mouthpiece manifold would bang against the patient’s teeth and mouth.

Continue reading

Opto-Electronic Plethysmography (OEP)

Although we routinely use mouthpieces, noseclips and occasionally masks for our testing, all of these alter respiration in one way or another. Opto-electronic plethysmography (OEP) is a completely non-invasive technique for measuring chest wall volume that also allows for regional differences in expansion and contraction of the thorax to be detected.

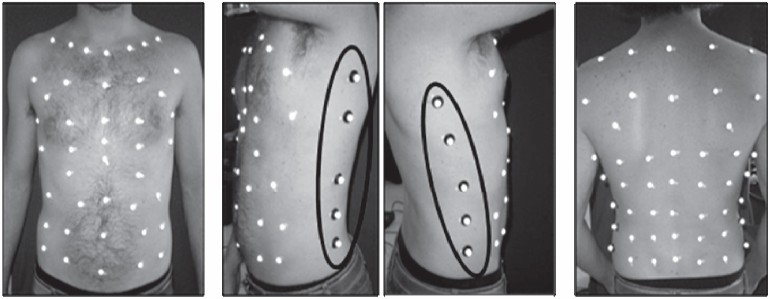
The basic idea is simple and is the same as is used in cinematic motion-capture systems. Small (6-10 mm) reflective hemispheres are attached to a subject’s torso with double sided tape. A set of 4, 6 or 8 high-speed (60-120 frames/sec) CCD cameras are then used to monitor both the overall and the relative motion of the hemispheres while the subject breathes. The accuracy of these measurements is claimed to be on the order of 0.2 mm.

OEP_Reflector_Placement

from Optoelectronic plethysmography: a review of the literature. Braz J Phys Ther 2012; 16: page 441.

The volume enclosed by the markers is analyzed geometrically by using a triangular or polyhedronal mesh. Since the triangles or polyhedrons are flat and human thoraxes are round-ish, volume tends to be underestimated to some degree. The amount of underestimation is closely related to the number of markers that are used and where they are placed. Research has shown that around 50 markers are needed for supine patients when only the anterior thorax is measured and more than 80 are needed for full coverage of upright patients. Reflectors need to cover the entire thorax, usually from the jugular notch on the upper chest to the iliac crest near the hips.

OEP_Triangular_Mesh

From Chest wall motion and lung volume estimation by optical reflectance motion analysis. J Appl Physiol 1996; 81: page 2683.

Continue reading