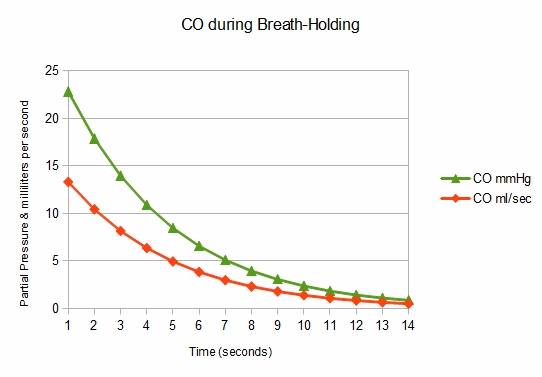
One misconception about DLCO results that I’ve heard over and over is that DLCO/VA is DLCO “adjusted” for lung volume and that using it is a way of “normalizing” DLCO for lung volume. This is not true and the information that DL/VA can give you about a patient’s lung without also considering VA as well is very limited and can be misleading.
WARNING, MATH AHEAD!
The equation for calculating DLCO is: 
This may look daunting but it has all the components that go into the DLCO test:
- VA is lung volume in ml that was observed during the test
- BHT is the breath-holding time in seconds
- 60 is the number of seconds in a minute
- Pb is barometric pressure in mmHg
- PH2O is the partial pressure of water vapor in the lung (usually assumed to be 47)
- Fitrace is the inspired fractional concentration of tracer gas (helium or methane)
- FAtrace is the expired fractional concentration of tracer gas (helium or methane)
- FICO is the inspired fractional concentrations of carbon monoxide.
- FACO is the expired fractional concentrations of carbon monoxide.
This part of the equation:
is actually the Krogh factor, or K. This has been described as the flux of CO across the alveolar membrane or the rate constant for CO uptake but it is more accurate to think of it as the rate at which the concentration of CO decreases in the lung during breath-holding. A simpler way to write the equation is therefore:
When you divide DLCO by VA what you get is:
Since BHT (breath-holding time), Pb (barometric pressure) and PH2O (the partial pressure of water vapor) are fairly constant this value is therefore primarily proportional to the Krogh factor itself. For this reason DLCO/VA tends to be referred to as KCO.
Now, let’s look into what the Krogh constant describes. During breath-holding, CO does not disappear from the lung linearly but in an exponential decay curve. This is because as CO leaves the lung the driving pressure (partial pressure across the alveolar membrane) of CO decreases.
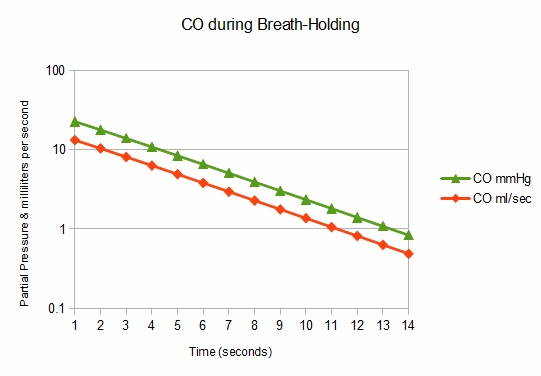
When you plot it on a logarithmic scale you get a straight line:
KCO normally increases as lung volume decreases below TLC for several reasons. Although there is a relationship between lung volume and alveolar surface area, surface area does not decrease at the same rate as lung volume. Next, the pulmonary capillary blood volume stays relatively constant as lung volume decreases. Finally (and this appears to be a somewhat overlooked factor) when lung volume is lower there are simply fewer carbon monoxide molecules present and the concentration drops faster. For these reasons the KCO at FRC tends to be more than 150% of what it is at TLC even though DLCO at FRC tends to be less than 80% of predicted.
Since KCO varies with lung volume, it is apparent it cannot be used to either “adjust” or “normalize” DLCO for lung volume. You cannot look at KCO in isolation, you must also look at VA and when you use lung volume to assess KCO you have essentially come full circle and are looking at DLCO once again.
KCO and VA are the major components of DLCO, however. When DLCO results are abnormal inspecting KCO and VA can help determine – within limits – the reasons for the reduction. A number of schemes for doing this have been proposed but once they get outside of simple relationships they tend to break down. For example a patient with interstitial disease will tend to have a decreased VA but a normal or decreased KCO. But since VA can be reduced because of maldistribution of the inhaled test gas mixture VA and KCO are often reduced in COPD as well. To use KCO and VA effectively you need to look outside the DLCO test and consider the patient’s spirometry and lung volume results and perhaps something of the patient’s medical history as well
References:
Brusasco V, Crapo R, Viegl G. Standardisation of the single-breath determination of carbon monoxide uptake in the lung. Eur Respir J 2005; 26: 720-735.
Hughes JMB. The single breath transfer factor (TL,CO) and the transfer coefficient (KCO)L a window onto the pulmonary microcirculation. Clin Physiol & Func Im 2003; 23:63-71.
Hughes JMB, Prie ND. In defense of the carbon monoxide transfer coefficient KCO (TL/VA) Eur Respir J. 2001; 17: 168-174
Hughes MB, Pride NB. Examination of the carbon monoxide diffusing capacity (DLCO) in relation to its KCO and VA compenents. Am J Respir Crit Care Med 2012; 186: 132-139.
Lipscomb DJ, Patel K, Hughes JMB. Interpretation of increases in the transfer coefficient for carbon monoxide (TLCO/VC or KCO). Thorax 1978; 33: 728-733.

PFT Blog by Richard Johnston is licensed under a Creative Commons Attribution-NonCommercial 4.0 International License.


Hi! Your blog was brought to my notice by my friend, Ira Bauer.
There are one or two mistakes in it.
The Krogh factor, as you present it, is dimensionless (only has concentrations). It should be divided by the BHT in minutes or seconds.
Thus the DLCO can be expressed more simply as VA x K/(Pb–PH2O)
The graphs. The ordinate is usually alveolar concentration of CO, but you can express this as PCO in mmHg, so the slope (the rate constant) is either 1/time or 1/(time x mmHg), but ml/sec is wrong for that axis.
You’re absolutely right about the need to divide by BHT. I was trying to keep the math simple and ended up over-simplifying.
I will let the graph stand as it is. There are two lines in each graph, one is CO concentration in the lung and the other is the transfer rate of CO across the alveolar membrane in ml/sec. The point I was trying to make is that the transfer rate of CO decreases as the CO concentration (driving pressure) decreases and the Y-axis is labeled “partial pressure and milliliters per second” accordingly. The values in the graph were based on a simple lung model using an “average” lung volume and DLCO.