Ve-VCO2 slope: Just to AT or all the way to the peak?

We’ve had some questions lately about some of our CPET guidelines. These questions were informational in nature not confrontational but they served to remind us that the reference values we use for CPET interpretation were developed and put in place at least ten years ago and it is past time they were reviewed. As a starting point I’ve been re-reading the ATS-ACCP and AHA statements on cardiopulmonary exercise testing. One sentence from the AHA statement concerning the Ve-VCO2 slope caught my eye. Specifically:

“… calculation of the Ve/VCO2 slope with all exercise data obtained from a progressive exercise test (initiation to peak effort) appears to provide additional clinical information compared with submaximal calculations (i.e. those that use linear data points before the steepening associated with ventilatory compensation for metabolic acidosis).”

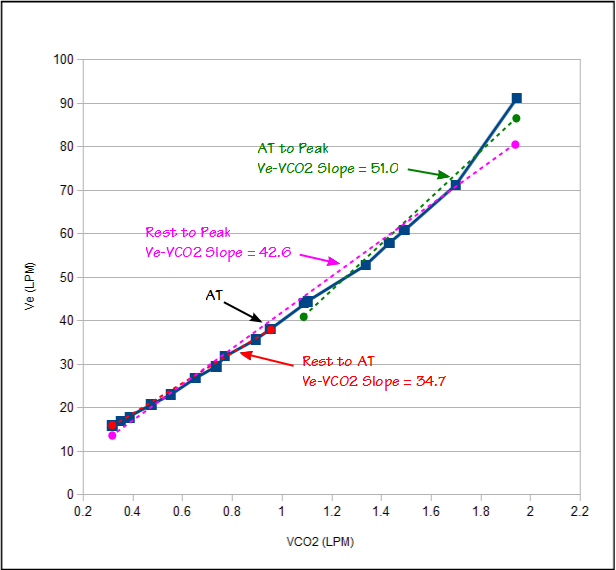
Ve-VCO2 slope is calculated using a linear regression function and we have been calculating it using only the test data between the start of exercise and the anaerobic threshold. The AHA statement however says we should be calculating it using the data all the way up to peak exercise (the ATS/ACCP statement is mute on this point since it does not even discuss Ve-VCO2 slope other than as a graph). Because Ve-VCO2 slope is a key component in our assessment of CPET results it is important that we get this right.

Ve and VCO2 have a reasonably linear relationship up to the anaerobic threshold. After the anaerobic threshold ventilation is driven by acidosis as well as CO2. This means that the Ve-VCO2 slope tends to be steeper (greater change in Ve per unit of VCO2) after anaerobic threshold than it was before. A Ve-VCO2 slope calculated from the entire CPET will therefore have steeper slope than one calculated using just using rest to AT.

VeVCO2 Slopes


Continue reading

Exercise Oscillatory Ventilation

Recently I was trying to make some sense of an exercise test report that had come across my desk. Numerical results on our CPET reports are averaged over 30 second periods and there seemed to be a lot of variability from one time interval to the next. This isn’t uncommon in the first couple of minutes of an exercise test because patients often start off too hard and too fast, overshoot and then take a while to settle down into a steady pattern. This variability however, persisted throughout the entire test. I finally realized that what I was seeing was Exercise Oscillatory Ventilation (EOV).

It has been a while since I last saw a patient with EOV. Part of the reason for this is that EOV is a sign of relatively advanced heart failure and most of the patients who have cardiac disease have already had standard ECG stress testing and tend not to get referred for a cardiopulmonary exercise test (CPET). Having said that, it is a bit surprising that we don’t see this more often since there tends to be an association between pulmonary disease and cardiac disease and we do exercise tests relatively frequently on patients with combined lung and heart disease in order to determine their primary cause for shortness of breath. Nevertheless, even though one study estimated that up to 30% of patients with heart failure exhibit EOV (although most studies estimate it somewhere between 7% and 12%), it is not something we have ever seen with any frequency.

Ve_vs_time_3

Continue reading

COPD, BD and IC

The ATS/ERS recommendation for assessing the response to bronchodilator is based solely on changes in FEV1 or FVC. An FEV1 that does not improve significantly following bronchodilator inhalation is considered to be one of the hallmarks of COPD. Many individuals with COPD however, can have symptomatic relief and an improvement in their exercise capacity without a significant post-bronchodilator increase in FEV1. This means that FEV1 may not be the only criteria for assessing bronchodilator response.

One of the hallmarks of COPD is expiratory flow limitation. This can cause hyperinflation and is often reflected in an elevated FRC. It is also an important factor in exercise limitation. When ventilation increases during exercise in an individual with COPD, expiratory flow limitation causes the tidal volume and FRC to shift towards higher lung volumes. FRC is difficult to measure during exercise so this usually observed by measuring Inspiratory Capacity (IC).

IC Exercise COPD

COPD patients who don’t show a significant change in their FEV1 can respond to bronchodilators by becoming less expiratory flow-limited and when this happens their FRC decreases. Bronchodilator response in these individuals can therefore be assessed by measuring pre- and post-bronchodilator FRC or IC. At present there appears to be a consensus that an increase in IC or decrease in FRC of at least 0.30 liters or 12% should be considered to be a significant response.

Continue reading

Assessing MVV results

The Maximum Voluntary Ventilation (MVV) test was initially described in 1933. It was the first pulmonary function test that involved inspiratory and expiratory air flow in a significant way and for this reason it helped to set the stage both conceptually and technically for the FEV1, the FEV1/FVC ratio and our present understanding of obstructive lung diseases. MVV is reduced in a variety of conditions, including obstructive, restrictive and neuromuscular diseases, but a reduced MVV is non-specific and this limits its clinical utility. Nevertheless, it continues to be performed both in clinical labs and for research, and for this reason it would seem to be a good idea to know how to assess MVV results.

As usual, there are two aspects to assessing pulmonary function results; test performance and normal values.

Currently the ATS/ERS statement on spirometry contains the only available standard for performing the MVV test. Unfortunately this standard also contains some significant flaws. Its primary recommendation is that the MVV test be performed with a tidal volume that is approximately 50% of the forced vital capacity and a breathing frequency of around 90 breaths per minute. These recommended values are problematic and some simple mathematics will show why.

A respiratory rate of 90 BPM means that there is 2/3 of a second for both inhalation and exhalation. With a 1:1 ratio for inspiration and expiration, there is only 1/3 of a second for exhalation. Since it normally takes a full second to exhale approximately 75% of the vital capacity (i.e. the FEV1), 1/3 of a second would only allow time to exhale 25% of the vital capacity (not exactly true of course, but it helps prove the point). How then is it possible to exhale 50% of the vital capacity, twice that amount, in the same amount of time? The answer is that it isn’t and if it was somehow possible for somebody to actually meet the ATS/ERS recommended values they would have an MVV that would be 45% to 100% higher than any of the predicted MVV’s. I suspect the ATS/ERS agrees this is a problem since following the initial recommendation it also says that “… since there are little data on MVV acceptability criteria, no specific breathing frequency or volume is required”.

The fact is that no single tidal volume recommendation is going to work for all patients and this is because the MVV tidal volume has to reside mostly within the maximal flow-volume loop envelope.

MVV_TV_FVL_01

Continue reading