During exhalation air flow occurs because of the pressure difference between the alveoli and the surrounding atmosphere. The increase in alveolar pressure acts to compress the air inside the lung and because of this compression the decrease in lung volume during exhalation is always going to be greater than the volume of exhaled air. This effect is known as Thoracic Gas Compression (TGC).
The flow rate that occurs for a given alveolar pressure depends primarily on airway resistance. When an individual has airway obstruction their airway resistance is increased and they often attempt to increase their expiratory flow by increasing the amount of force they apply during exhalation. This increased force further compresses the air inside the lung and increases TGC. Numerous researchers have shown that there is usually a substantial differences in TGC between subjects with normal lungs and those with airway obstruction.
Routine spirometry and lung volume tests cannot measure thoracic gas compression. It can only be measured in a special kind of plethysmograph. Unfortunately the nomenclature for this type of plethysmograph is a bit muddy and it is variously known as a transmural, constant pressure, volume-displacement or flow plethysmograph (I prefer volume-displacement because I think this sums up its mode of operation most succinctly). In this type of plethysmograph the subject breathes in and out through an opening in the box. The expansion and contraction of their lungs causes air to flow in and out of the box through a separate opening. The pressure inside the plethysmograph is monitored and used to compensate for any delays in box flow.
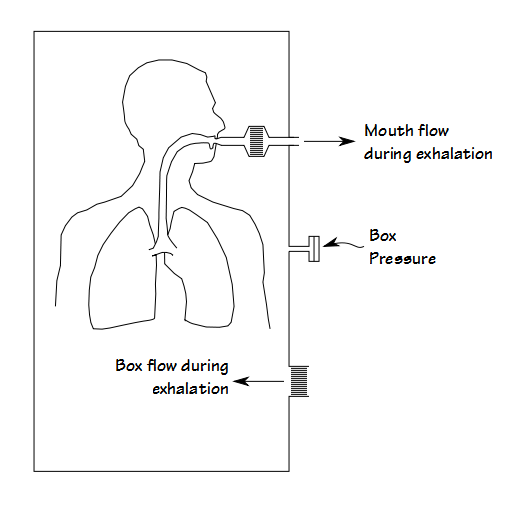
Volume-displacement plethysmography
