Graphical Analysis of Flow-Volume Loops

I’ve been thinking a bit about the shape of flow-volume loops lately. In part this has been about ways to accurately describe them in reports; in part speculation about the information that may be embedded in them that isn’t in any of the routinely reported spirometry values; and in part about how the human eye perceives and categorizes them in a way that is difficult to simplify and put into a computer algorithm. A couple days ago I found a recent article where a geometrical analysis was applied to flow-volume loops in individuals with COPD and this got me curious about what other graphical techniques have been used to analyze flow-volume loops.

Given how long flow-volume loops have been around (over 50 years) the graphical analysis of flow-volume loops has been attempted remarkably few times. Excluding a handful of strictly numerical approaches (based primarily on MEF and MIF ratios) I was only able to find three graphical analysis techniques. I think this small number says volumes about the difficulty of analyzing flow-volume loop shapes meaningfully. Despite different degrees of sophistication the reality is that none of these techniques has ever seen any kind of common usage. Even so these attempts are both interesting and instructive.

The most recent technique is a fairly straightforward geometric approach from Lee et al and its use appears to be limited primarily to individuals with airway obstruction.

FVL_Geometric_1

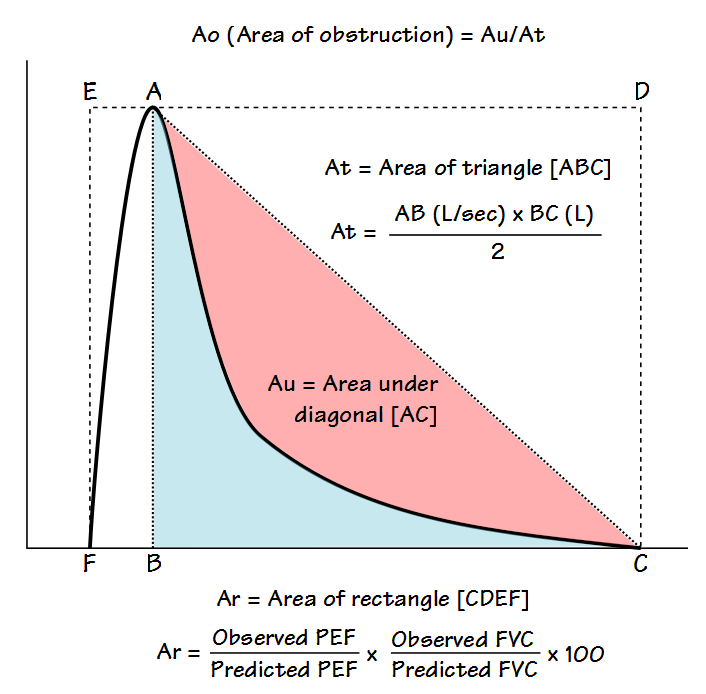
The flow-volume loop is analyzed primarily to determine what the authors call the Area of Obstruction (Ao). To do this, a diagonal line is drawn from peak flow to the end of exhalation. The area that exists between the actual flow-volume loop contour and this diagonal line is defined as the area under the diagonal (Au). The area of Au is then compared to the area of a triangle (At) defined by the peak flow, the exhaled volume at the time of the peak flow, and the end of exhalation. The area of obstruction, which is actually a ratio, is then calculated as:

Continue reading

Hidden FIVC and FVC. When all the data is relevent.

For the first dozen or so year that I worked in a pulmonary function lab it was with counter-weighted, volume-displacement water-seal spirometers more or less like this:

Spirometer_Collins_13_5_Liter_Respirometer_1967

Patients would do a series of tests and I’d end up with a bunch of pen traces on kymograph paper that I’d have to measure with a ruler and use a desktop calculator (it was about a foot square, weighed a couple of pounds and had a nixie tube digital display) to create a hand-written report. I’m not going to suggest that these spirometers were in any way better than what we’re using now but I have to say that I would have seen the following problems more or less immediately.

Recently I was reviewing a report from a patient with very severe obstruction and noticed something a bit off about the flow-volume loop. Specifically, the end-exhalation of the tidal loop looked like it was at a significantly higher volume than the end of the FVC effort.

Hidden_FIVC_2_FVL

Because the high-frequency sawtooth pattern (from the patient, not the equipment) makes it a little hard to see if this is what was really happening, I downloaded the raw data and re-graphed the volume-time curve with a spreadsheet.

Continue reading

Goiter, upper airway obstruction and the flow-volume loop

The thyroid gland is located across the front of the upper airway a short distance below the larynx. An enlarged thyroid gland is known as a goiter. The most common worldwide cause of goiter is an iodine deficiency. This is much less common in the western nations where factors such as Hashimoto’s thyroiditis, Graves’ disease, multi-nodular thyroid disease, thyroid cancer, pregnancy and the side effects of some medications are the its primary causes. Common respiratory complaints associated with goiter include cough, hoarseness, shortness of breath and stridor.

thyroid-gland

[illustration from HealthyThyro.com]

When a goiter is large enough it can press against the trachea and cause a narrowing or deviation of the upper airway. My lab usually gets at least a couple of patients referred to us every year with a diagnosis of goiter and a request that we assess whether it is causing any significant airway obstruction. Decades ago I was taught by my medical director that when this occurs it shows up as an expiratory plateau on a flow-volume loop.

FVL_Expiratory_Plateau

The reality (as usual) is more complex and this is mostly because the thyroid gland lies close to the boundary between the extrathoracic and intrathoracic sections of the trachea. Depending on its size and the which direction the thyroid expands towards, goiter can show up as an extrathoracic or intrathoracic airway obstruction. Even more importantly, as a recent article in Chest showed, the airway obstruction from goiter can be dependent on body position as well.

Continue reading

A real fixer-upper

I was reviewing reports today when I ran across one with some glaring errors. There were several things that immediately told me that the reported plethysmographic lung volumes were way off; the VA from the DLCO was almost a liter and a half larger than the TLC and the SVC was only about half the volume of the FVC.

Table1

When I took a look at the raw test data I saw at least part of the reason why the technician had selected these results to be reported and that was because the SVC quality from most of the efforts was poor. They mostly looked like this:

Fixer_Upper_01

It is apparent that the patient leaked while panting against the closed shutter and this caused the FRC baseline to shift upwards. I’ve discussed this problem previously, but when this happens the RV is larger than the FRC, there is a negative ERV and the TLC is overestimated. There is no way to fix this problem from within the software. The FRC is determined by the tidal breathing before the shutter closes and cannot be re-measured afterward.

Continue reading

Proposal to improve the readability of flow-volume loops

I’ve been planning on putting together a tutorial on characterizing and interpreting the contours of flow-volume loops so I’ve been accumulating flow-volume loops that are examples of different conditions. Lately I was reviewing some of them and noticed that when I tried to compare loops from different individuals with similar baseline conditions that the different sizes of the flow-volume made this difficult. For example, these two loops are both from individuals with normal spirometry.

FVL_Scaling_05

FVL_Scaling_08

One is from short, elderly female and one is from a tall, young male. If all you had to look at was the flow-volume loops, you might think that the smaller loop was abnormal, but the larger loop actually comes from a spirometry effort with an FVC that was 92% of predicted while the smaller loop’s FVC was 113% of predicted. The difference in sizes of these loops is of course due to the difference in age, gender and height between these individuals but also because of settings we’ve made in our lab software and because of the ATS/ERS spirometry standards.

Continue reading

Tidal flow-volume loops

I was reviewing a spirometry report and noticed something odd about the flow-volume loop, or more specifically the tidal loop, and this got me to thinking about what tidal loops can tell us about test quality, patient physiology and the ability of the technician to coach a spirometry test.

FVC_with_no_IC_Redacted2

There are at least a couple things wrong with this FVC test effort. First the exhalation time was only about 3 seconds so the FVC volume was likely underestimated by a fair amount. Second, it wasn’t reproducible and this was actually the patient’s the best test effort. What I noticed however, was that the tidal loop was shifted almost completely to the left.

There are a number of criteria for assessing the quality of a forced vital capacity. Exhalation quality can be determined reasonably well by back extrapolation, expiratory time and the terminal expiratory flow rate. When it comes to assessing the completeness of the inspiration that precedes the exhalation however, there really isn’t much to go on other than the reproducibility of an individual’s spirometry efforts.

When I measured the tidal loop what I saw was that IRV was about 0.10 L and the ERV, although likely underestimated by a fair amount, was at least 0.80 L. What I actually think this tidal loop is saying is that the patient didn’t take as deep a breath as they could at the start of the test, but what other things could affect the position of the tidal loop?

Continue reading

What’s up with Peak Flow?

Two PFT reports came across my desk recently and comparing them got me to thinking about Peak Expiratory Flow (PEF). The FEV1 from both tests were mildly reduced with an FEV1/FVC ratio that was moderately reduced and an FVC that was within normal limits.

Peak_Flow_1

Observed: %Predicted:
FVC (L): 3.72 96%
FEV1 (L) 2.17 78%
FEV1/FVC (%): 58 80%
PEF (L/sec): 2.97 41%

Peak_Flow_2

Observed: %Predicted:
FVC (L): 2.46 88%
FEV1 (L) 1.66 75%
FEV1/FVC (%): 67 83%
PEF (L/sec): 7.65 128%

Both tests also showed mild airway obstruction but despite this the Peak Flows were quite different. One test had a PEF that was moderately to severely reduced and the other had a PEF that was elevated. It’s fascinating that two such completely different flow-volume loops are so numerically similar.

In another sense, though, how can these two different spirometry efforts both be labeled as mild airway obstruction? Or more importantly, they both may be mild obstruction but isn’t the quality of the obstruction different?

Continue reading

Is it Dynamic Hyperinflation or something else?

Patients with COPD often have a ventilatory limitation as their primary limitation to exercise. A ventilatory limitation to exercise has traditionally been assessed by the breathing index or the breathing reserve:

breathing index = Peak Ve / Predicted MVV

breathing reserve = 1 – (Peak Ve / Predicted MVV)

which are basically two different ways of saying the same thing. In either case a breathing index greater than 85% or breathing reserve less than 15% is an indication that a patient has reached a ventilatory limit to exercise. There is some disagreement as to whether the predicted MVV should come from a MBC test performed by the patient or from the patient’s FEV1 x 40. I have tried both approaches and my experience has been that FEV1 x 40 is the best indicator for a patient’s predicted MVV. This is also Wasserman’s (my go-to source for exercise testing) recommendation so this is what we use.

Individuals with COPD are occasionally hyperinflated at rest (i.e. elevated FRC and RV) and more commonly they dynamically hyperinflate during exercise. Research has shown that those individuals with are flow-limited during tidal breathing at rest almost always hyperinflate with exercise. Patients who are not flow-limited at rest but still have a low FEV1 and FEV1/FVC ratio may also hyperinflate. Because hyperinflation limits a patient’s tidal volume response to exercise it may cause an individual to have a limitation to exercise that occurs at a minute volume below the 85% threshold.

Exercise IC

Continue reading

Inspiratory Flow-Volume Loops

Recently I was discussing a flow-volume loop with one of our pulmonary physicians. His concern was whether the loop, which was from a patient with a cracked hyoid, was showing inspiratory obstruction or not. I had to point out that the inspiratory flows on the loop in question came from the pre-FVC inspiration that started at FRC, not RV, and that we don’t emphasize maximal inspiratory flow at that point in the test, just maximal inspiratory volume and for these reasons the flow-volume loop was not a reliable indicator of inspiratory obstruction.

IFVL

Continue reading

An IC shows it’s probably not restriction

For the last couple of years it seems that I’ve had more problems than usual with lung volume tests. Even though this seems to date from the time that my lab went through its hardware and software upgrade and we started performing N2 washouts I suspect that these problems have been around for a long time and these events just heightened my awareness of lung volume testing problems.

My lab performs helium dilution, N2 washout and plethysmographic lung volume tests. When you are assessing the quality of lung volume tests the first problem for the helium dilution and plethysmographic techniques is whether or not the Functional Residual Capacity (FRC) was accurately measured and for N2 washout, it’s whether or not the Residual Volume (RV) was accurately measured. Leaks are always an issue for any of these measurement techniques and for helium dilution and N2 washout leaks will almost always cause the Total Lung Capacity (TLC) to be overestimated. For plethysmography the picture is less clear since leaks can cause TLC to be either over- or under-estimated.

Once you accept that the initial measurement of FRC or RV is accurate, however, the next question is whether the SVC is accurate or not. Since SVC is a more relaxed test than a forced vital capacity the SVC volume should be at least the same as the FVC volume and it is often larger. When I see an SVC that is smaller than the FVC I tend to think that the calculated TLC is probably okay and it’s the RV that is more likely to be overestimated. This is because the Inspiratory Capacity (IC) part of the SVC maneuver (“take as deep breath in as you can!”) is the easiest part and when the SVC is low, it is usually because the Expiratory Reserve Volume (ERV, “blow everything out that you can!”) is underestimated.

This report came across my desk a couple of days ago. The lung volumes were performed by helium dilution.

Not_RVD_Results 

Continue reading