Z Score to remember is -1.645

The use of Z scores to report PFT results, both clinically and for research is occurring more and more frequently. Both the Z score and the Lower Limit of Normal (LLN) come from the same roots and in that sense can be said to be saying much the same thing. The difference between the two however, is in the emphasis each places on how results are analyzed. The LLN primarily emphasizes only whether a result is normal or abnormal. The Z score is instead a description of how far a result is from the mean value and therefore emphasizes the probability that a result is normal or abnormal.

Reference equations are developed from population studies and the measurements that come from these studies almost always fall into what’s called a normal distribution (also known as a bell-shaped curve).

A normal distribution has two important properties: the mean value and the standard deviation. The mean value is essentially the average of the results while the standard deviation describes whether the distribution of results around the mean is narrow or broad.

The simple definition of the Z score for a particular result is that it is the number of standard deviations that a result is away from the mean. It is calculated as:

Continue reading

COPD and the FEV1/FVC ratio. GOLD or LLN?

Everyone uses the FEV1/FVC ratio as the primary factor in determining the presence or absence of airway obstruction but there are differences of opinion about what value of FEV1/FVC should be used for this purpose. Currently there are two main schools of thought; those that advocate the use the GOLD fixed 70% ratio and those that instead advocate the use the lower limit of normal (LLN) for the FEV1/FVC ratio.

The Global Initiative for Chronic Obstructive Lung Disease (GOLD) has stated that a post-bronchodilator FEV1/FVC ratio less than 70% should be used to indicate the presence of airway obstruction and this is applied to individuals of all ages, genders, heights and ethnicities. The official GOLD protocol was first released in the early 2000’s and was initially (although not currently) seconded by both the ATS and ERS. The choice of 70% is partly happenstance since it was one of two fixed FEV1/FVC ratio thresholds in common use at the time (the other was 75%) and partly arbitrary (after all why not 69% or 71% or ??).

The limitations of using a fixed 70% ratio were recognized relatively early. In particular it has long been noted that the FEV1/FVC ratio declines normally with increasing age and is also inversely proportional to height. For these reasons the 70% threshold tends to over-diagnose COPD in the tall and elderly and under-diagnose airway obstruction in the short and young. Opponents of the GOLD protocol say that the age-adjusted (and sometimes height-adjusted) LLN for the FEV1/FVC ratio overcomes these obstacles.

Proponents of the GOLD protocol acknowledge the limitation of the 70% ratio when it is applied to individuals of different ages but state that the use of a simple ratio that is easy to remember means that more individuals are assessed for COPD than would be otherwise. They point to other physiological threshold values (such as for blood pressure or blood sugar levels) that are also understood to have limitations, yet remain in widespread use. They also state that it makes it easier to compare results and prevalence statistics from different studies. In addition at least two studies have shown that there is a higher mortality of all individuals with an FEV1/FVC ratio below 70% regardless of whether or not they were below the FEV1/FVC LLN. Another study noted that in a large study population individuals with an FEV1/FVC ratio below 70% but above the LLN had a greater degree of emphysema and more gas trapping (as measured by CT scan), and more follow-up exacerbations than those below the LLN but above the 70% threshold.

Since many of the LLN versus GOLD arguments are based on statistics it would be useful to look at the predicted FEV1/FVC ratios in order to get a sense of how much under- and over-estimation occurs with the 70% ratio. For this reason I graphed the predicted FEV1/FVC ratio from 54 different reference equations for both genders and a variety of ethnicities. Since a number of PFT textbooks have stated that the FEV1/FVC ratio is relatively well preserved across different populations what I initially expected to see was a clustering of the predicted values. What I saw instead was an exceptionally broad spread of values.
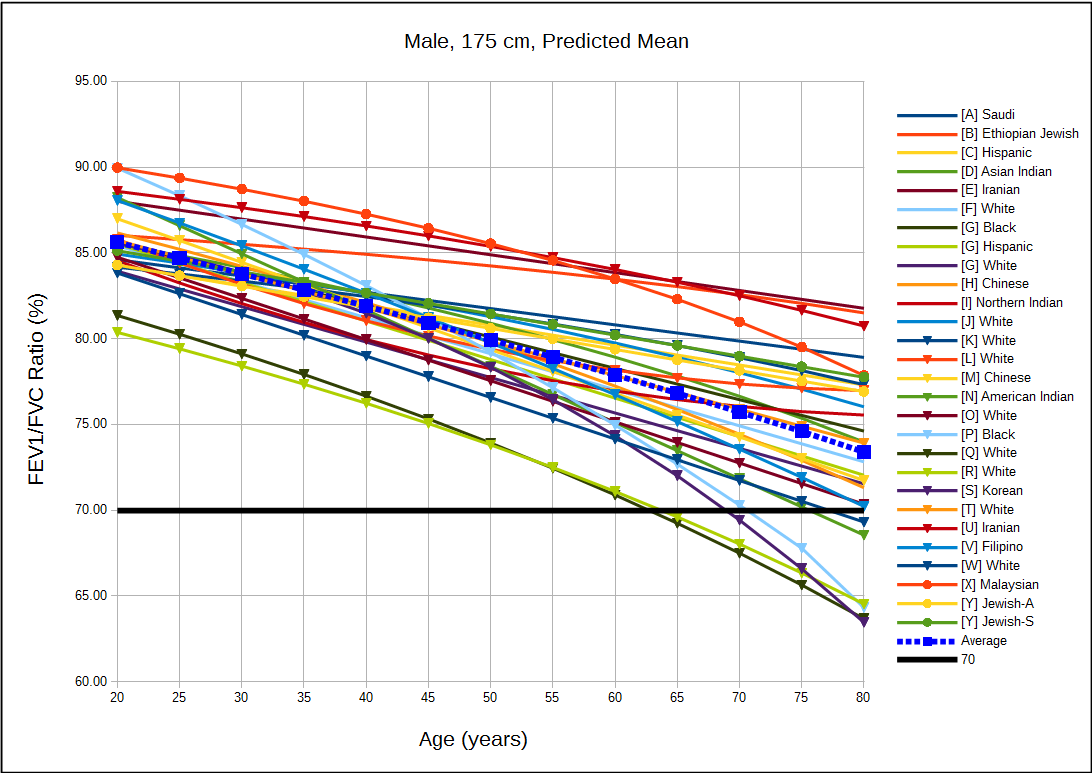
Male_175cm_Predicted

[more] Continue reading

LLN versus 80%

Recently a rather eminent reader commented on an older blog entry. He finished his comment with a paragraph on another topic, however. Specifically:

By the way, it is also high time that we scuttle the habit of expressing a measurement as percent of predicted. As Sobol wrote [5]: “It implies that all functions in pulmonary physiology have a variance around the predicted, which is a fixed per cent of predicted. Nowhere else in medicine is such a naive view taken of the limit of normal.”

I understand the point and have been thinking about this off and on since the comment was posted but I keep coming back to the same response, and that is “yes, but…”.

First the “yes” part.

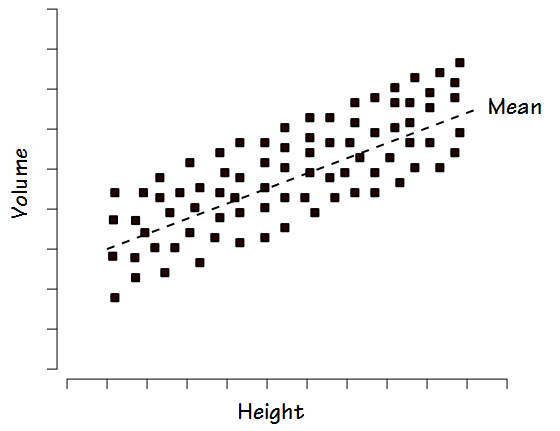
Other than the fact that any percent of predicted cutoff is an arbitrary line in the sand (80% of predicted is most commonly used as the cutoff for normalacy but why not 75%? why not 85%?) the biggest argument against the use of percent predicted is the way in which normal values tend to be distributed. When FVC or TLC is studied within a reasonably large group of “normal” individuals the results are usually distributed fairly evenly above and below the mean. This is referred to as a homoscedastic distribution.

Homoscedastic_Distribution

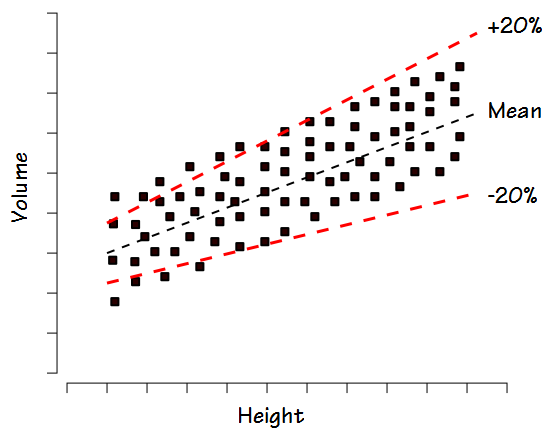
For this reason when, for example, +/- 20% is used as the normal range this tends to exclude some normal individuals with lower volumes and heights and includes some individuals with larger volumes and heights that are probably not normal.

Homoscedastic_versus_20pct

Continue reading

What’s normal about the FEV1/FVC ratio?

The FEV1/FVC ratio is used to estimate the presence and degree of airway obstruction. For well over thirty years my lab has used an FEV1/FVC ratio of 95% of predicted as the cutoff for normalcy. This value (carved onto a stone tablet by the way) had been brought to the lab by a founding physician who had come to the department from the NIH in the 1970’s. Since the software and hardware upgrade this summer our PFT Lab has switched to the NHANES III spirometry reference equations but we have so far resisted changing our 95% cutoff to the lower limit of normal (LLN). This is due in part to inertia but also in part to a mistrust in the concept of LLN. We have been steadily re-evaluating all of our testing criteria and have turned again to the FEV1/FVC ratio with the question as to whether our 95% cutoff is over-zealous or whether the LLN is too lax.

Strictly speaking LLN is a statistical concept. In the NHANES III study (and most others) it is computed as the mean predicted value minus 1.645 times the standard estimate of error. Unlike the reference equations for FVC and FEV1 which use both height and age as factors, the NHANES III reference equations for the FEV1/FVC ratio are derived solely from age. It is not clear to me this is completely correct and I have discussed some of the discrepancies between the NHANES III predicted FEV1/FVC ratio and height in a prior posting but it does make analyzing the LLN for the ratio easy. For adult, Caucasian males the reference equations are:

Continue reading