Airway obstruction and the FVC

Spirometry is the most commonly performed (and mis-performed) pulmonary function test around the world. The apparent simplicity of spirometry is misleading since there are numerous subtleties that have a significant effect on the results.

I suspect that when the FVC is thought about it is most often considered to be an index towards the total capacity of the lung. That’s certainly true in it’s own way, but the FVC is actually a critically important factor when determining airway obstruction. I’ve had a number of reports across my desk lately where the patient had a reasonably large change in FVC when compared to their last visit but little change in FEV1, and this has made a difference in how the results are interpreted. For example:

Visit 1: Observed: %Predicted: Predicted:
FVC: 4.27 87% 4.91
FEV1: 3.36 84% 3.99
FEV1/FVC: 79 96% 82
Visit 2: Observed: %Predicted: Predicted:
FVC: 4.67 95% 4.91
FEV1: 3.38 85% 3.99
FEV1/FVC: 72 88% 82

Although the change in FVC is not significant by my lab’s standards (+0.40 L, +9%) and the FEV1 has hardly changed at all, the FEV1/FVC ratio has gone from being within normal limits to being under the LLN and therefore showing mild airway obstruction. Continue reading

LLN versus 80%

Recently a rather eminent reader commented on an older blog entry. He finished his comment with a paragraph on another topic, however. Specifically:

By the way, it is also high time that we scuttle the habit of expressing a measurement as percent of predicted. As Sobol wrote [5]: “It implies that all functions in pulmonary physiology have a variance around the predicted, which is a fixed per cent of predicted. Nowhere else in medicine is such a naive view taken of the limit of normal.”

I understand the point and have been thinking about this off and on since the comment was posted but I keep coming back to the same response, and that is “yes, but…”.

First the “yes” part.

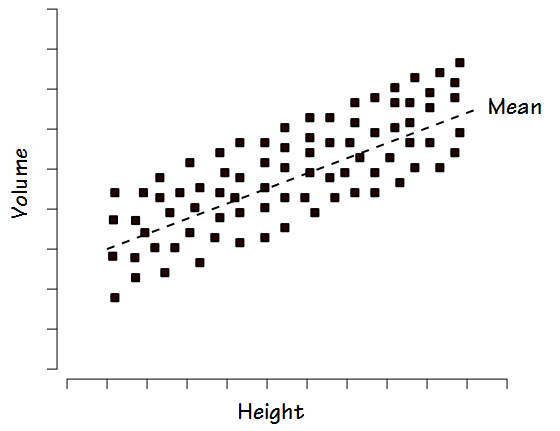
Other than the fact that any percent of predicted cutoff is an arbitrary line in the sand (80% of predicted is most commonly used as the cutoff for normalacy but why not 75%? why not 85%?) the biggest argument against the use of percent predicted is the way in which normal values tend to be distributed. When FVC or TLC is studied within a reasonably large group of “normal” individuals the results are usually distributed fairly evenly above and below the mean. This is referred to as a homoscedastic distribution.

Homoscedastic_Distribution

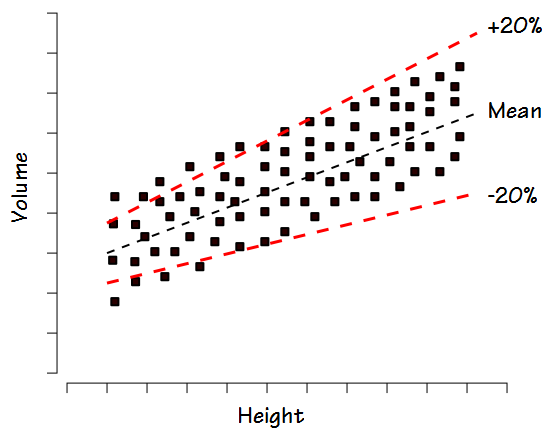
For this reason when, for example, +/- 20% is used as the normal range this tends to exclude some normal individuals with lower volumes and heights and includes some individuals with larger volumes and heights that are probably not normal.

Homoscedastic_versus_20pct

Continue reading

State Licensure requirements for PFT Testing

There has been a fair amount of confusion about PFT lab staff licensure requirements. This information is not available on the AARC website, nor on any of the AARC state society websites. A month or so ago I reached out to all of the AARC state societies but received responses from only a handful of them. I was recently able to complete this research however, by visiting the websites of the remaining state licensing boards and state legislatures.

It turns out that the majority of states require licensure of PFT Lab staff, most often by requiring CRT or RRT credentials, occasionally by allowing CPFT and RPFT credentials and in a couple of cases, a state licensure exam. There were also a couple of cases where the regulations were so vaguely written that it wasn’t clear whether pulmonary function testing fell under the Respiratory Care practitioner scope of practice or not.

Anyway, based on state society feedback and my best interpretation of the relevant laws and regulations, the following list should be a reasonably accurate look at the licensure requirements for each state.

Continue reading