Does the FEV1/SVC ratio over-diagnose airway obstruction?

A low FEV1/VC ratio is the primary indication for airway obstruction.

ATS_ERS_Interpretation_Algorithm

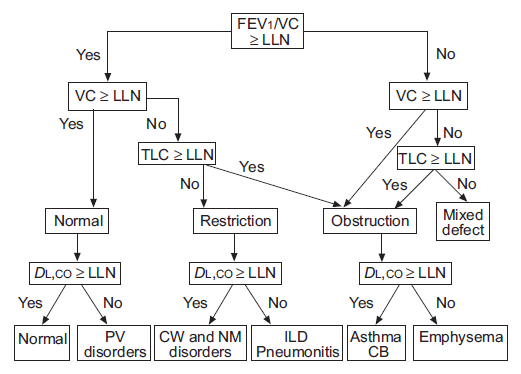
From ATS/ERS Interpretive Strategies for Lung Function tests, page 956.

The ATS/ERS statement on interpretation says

The VC, FEV1, FEV1/VC ratio and TLC are the basic parameters used to properly interpret lung function (fig. 2). Although FVC is often used in place of VC, it is preferable to use the largest available VC, whether obtained on inspiration (IVC), slow expiration (SVC) or forced expiration (i.e. FVC).”

I understand and in general agree with the idea of using the largest VC regardless of where it comes from and this is because the FVC is often underestimated for any number of good (and not so good) reasons. When this happens the FEV1/FVC ratio will be overestimated and airway obstruction will be under-diagnosed. However the ATS/ERS statement is also grounded in the notion that all vital capacities (FVC, SVC, IVC) are the same and this isn’t necessarily true. The problem comes from the fact that the predicted values and lower limit of normal (LLN) for the FEV1/VC ratio always come from reference equations for FEV1/FVC ratios. Because the SVC (and IVC) are usually larger than the FVC this means there is at least the potential for airway obstruction to be over-diagnosed.

Continue reading

When flow-volume loops get kinky

One of the more recognizable flow-volume loop contours is the one associated with severe airway obstruction. Specifically, this type of loop shows an abrupt decrease in flow rate following the peak flow with a more gradual decrease in flow rates during the remainder of the exhalation.

V_Sev_OVD_03_Cropped

This abrupt decrease in flow rates was first described on a volume-time curve and the inflection point was called a “kink” but this point also corresponds with the inflection point on the flow-volume loop. This feature has also been called a “notch” or a “spike” but a number of researchers have called this the Airway Collapse pattern (AC) and it is more formally defined as a sharp decrease in flow rate from peak flow to a discontinuity point at less than 50% of the peak flow and occurring within the first 25% of the exhaled vital capacity.

Continue reading

What’s a normal Flow-volume Loop?

Dozens of articles have been written about the correlation between different abnormal flow-volume loop contours and pulmonary disorders. In contrast very little has ever been written about what constitutes a normal flow-volume loop and what this looks like has been primarily anecdotal.

Interestingly, the ATS/ERS standard for spirometry includes an example of a “normal” flow-volume loop but its source and what makes it normal is not explained.

ATS_ERS_Normal_FVL

From the ATS/ERS standard on spirometry, page 327.

One feature that is commonly seen as a feature of normal flow-volume loops has been variously called a ‘shoulder’ or ‘knee’.

Normal_FVL_Shoulder

Continue reading