One more DLCO technique: DLCO measured during exhalation (Intrabreath DLCO)

There have been numerous criticisms of the single-breath DLCO technique, many of them quite valid. In particular, the standard equation for calculating DLCO makes no consideration for the inspiratory and expiratory phases of the maneuver when lung volume and the alveolar capillary surface area are changing. Some investigators have devised ways of correcting for inhalation and exhalation, however other investigators have sidestepped the issue entirely by showing that DLCO can instead be calculated from information acquired only during exhalation.

During exhalation, once the gas that exits the lung leaves the alveoli, diffusion ceases. Gas that exits the lung during the early part of exhalation will have had less time for CO to diffuse from the alveoli into the pulmonary capillaries and will have a higher concentration of carbon monoxide than will gas that exits later. Exhaled gas can therefore be considered to consist of a continuous set of alveolar gas samples, separated by time and the differences between these “samples” can be used to calculate DLCO.

Several techniques have been developed to calculate DLCOexh. What these techniques have in common is that they all use a relatively standard single-breath DLCO gas mixtures in conjunction with fast responding carbon monoxide and helium or methane gas analyzers. They also require the subject exhale slowly (approximately 0.5 L/sec) after inhaling the DLCO gas mixture to TLC. The primary differences between these techniques lies in the way DLCOexh is calculated.

DLCOexh – Point Sample Technique:

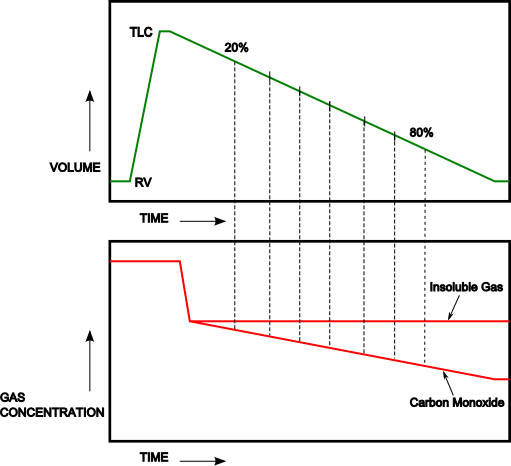
In the study of Newth et al [9] the carbon monoxide and helium gas concentrations were determined for the midpoint of each 10% decrement in lung volume from 20% to 80% of the subjects exhaled volume.

DLCO_04_02_exh_Graph1 

Continue reading

Selecting a DLCO test in order to show airway obstruction

When DLCO tests are performed my lab’s standard policy to average two or more results that meet the criteria for quality and reproducibility. It is not unusual for us to perform three DLCO tests and have all of them meet quality criteria but to have one test result that is higher than the other two. Unlike spirometry tests, bigger isn’t necessarily better for DLCO, so in a circumstance like this we will average the two closest results rather than choose the highest result. Even though the higher test results can come from a DLCO test with good quality, I think that reproducibility trumps this and that choosing by reproducibility gives us results that are more clinically reliable.

When I review spirometry results and either lung volumes or a DLCO test has also been performed, I will always check the Slow Vital Capacity(SVC) from the lung volumes and the Inspiratory Volume (Vinsp) from the DLCO test to see if they are larger than the reported Forced Vital Capacity. If either of them is I will manually re-calculate the FEV1/VC ratio to see if it indicates the presence of airway obstruction. This is in line with the ATS-ERS recommendations to use the largest Vital Capacity, regardless of the source, for the FEV1/VC ratio.

I have been reviewing the raw test data for all DLCO tests (as well as all the lung volume tests and regular spot checks on spirometry) performed in my lab for at least the last year. Since our software and hardware upgrade a year and a half ago we’ve found a number of problems that have significant effects on the DLCO test results. Depending on the problem they are capable of causing the results to be over- or under-estimated. All of the technicians performing the tests are now well aware of these problems and there haven’t been any problematic DLCO tests selected for a while. Nevertheless, I always check the raw data just to be sure.

Today, I ran across a report that looked quite straightforward. A set of spirometry and DLCO tests had been performed on a frequent-flier patient with pulmonary fibrosis. The patient has restrictive lung disease and lung volumes measured about a year ago were 64% of predicted. Even though the patient’s FVC has decreased since then there is no clinical reason to repeat the lung volume measurements. The results looked like this: 

  Observed: %Predicted: Predicted:
FVC (L): 2.28 51% 4.45
FEV1 (L): 1.64 51% 3.21
FEV1/FVC (%): 72 100% 72
DLCO ml/min/mmHg: 12.03 50% 24.23
Vinsp (L): 2.29    

Continue reading

How should predicted TLC and RV be derived?

The ATS-ERS standards on lung volume measurements says that measured TLC and RV can be calculated either by

RV = FRC – ERV then TLC = RV + SVC

or by

TLC = FRC + IC then RV = TLC – SVC

with the preference going to the first method. Strictly speaking, given the same FRC and SVC measurements either method is going to end up with exactly the same calculated TLC and RV values. Conceptually speaking I believe that TLC = FRC + IC is a more relevant way to think about TLC but this is only because I think that patients find it easier to perform a quality IC maneuver than a quality ERV maneuver.

A while back I found out that the predicted TLC in my lab’s test systems was being derived from the predicted RV from one set of equations and the predicted FVC from another set of equations (i.e. predicted TLC = predicted RV + predicted FVC). This is likely done so that there will be no discrepancy between the predicted FVC and predicted SVC on reports. I am not sure this is the correct decision since SVC does tend to be slightly larger that FVC but the difference is admittedly small (<1%) in healthy subjects so it is not likely to be significant.

Does it matter, however, for predicted TLC and RV which value’s reference equation you start with and which FVC reference equation you use with them? 

There are, of course, many different reference equations for lung volumes and spirometry, but to keep this simple I will choose the ones that I think are the most common and most relevant. For a 50 year old, 175 cm Caucasian male therefore, the predicted lung volumes look like this:

Equation: TLC FRC RV SVC
Quanjer 6.90 3.42 2.16 4.74
Crapo 6.74 3.60 1.98 4.76

Continue reading

LOINC, and why it matters to your HIS Interface

The Hospital Information Systems (HIS) at different medical centers have grown up mostly in isolation from each other. Even when an HIS is installed by a national vendor, each individual hospital has tended to make its own customizations and to follow past conventions. This is changing and it is changing because there are a number of issues driving rapid improvements in inter-hospital communication. The Meaningful Use (MU) Act is major factor and one that has been helping to set the pace, but because improved communication lowers costs and improves the quality of care insurers and medical institutions have been moving in this direction for their own reasons as well.

The regulations and standards for Health Information Exchange (HIE) are evolving rapidly. The overall framework for HIE resides in the Consolidated Clinical Data Architecture (C-CDA) and HL7 messaging protocols. This has given hospitals a unified approach towards managing their communication channels between physicians, clinics, other hospitals and insurers but one problem limiting the usefulness of this has been the different nomenclature used by different institutions for the same pieces of information.

When databases are grown in isolation they tend to end up with labels for data elements that are idiosyncratic and unique to each medical center. There needs to be a way to resolve this Tower of Babel and that is what the Logical Observation Identifiers Names and Codes (LOINC) organization is doing.

Continue reading

Using an HIS Interface as your report manager

The last several decades has seen a complete transition to the use of computers in pulmonary function testing. This has improved Lab efficiency, but it is also the new baseline. Further improvements in technology may improve the reliability and accuracy of test equipment and test results, but it is unlikely to improve PFT Lab efficiency any more than it already has.

Report management, which is really information management, has started but hasn’t yet completed the same technological transition and it is here that significant improvements can still be made. These improvement will not only improve the efficiency of the pulmonary function lab, but also its clinical effectiveness for the physicians and patients that are the lab’s customers.

To one degree or another most pulmonary function labs are still dominated by traditional reporting systems which are labor intensive and slow. Managing paper reports for a patient visit usually consists of:

  • Patient reports are kept in folders and either a new folder needs to be created or the patient’s existing folders need to be pulled from file cabinets.
  • Printing the test results and then collating the reports with patient’s lab folder.
  • Delivering a stack of reports and lab folders to a reviewer who makes penciled notes on the reports.
  • The stack of reports and lab folders is transferred to a typist who types the interpretation into the lab database.
  • The final reports are printed, collated with the patient lab folders and stack of lab folders and reports are delivered to the physician who then physically signs each report.
  • Reports are photocopied and snail-mailed to the ordering physician and medical records.
  • The lab folders are re-filed.

Not every pulmonary function lab still uses all of these steps to manage reports of course, but large parts of this overall process are often still major components in report management. So why are we still moving paper around when what we really want to do is to move the information that’s on the paper around?

Continue reading