A physician associated with my PFT lab has become an investigator for a device study intended for patients with severe COPD. One of the major criteria for patients to be able to enroll in this study is a severely elevated Residual Volume (RV). Patients who have met this criteria at other PFT labs in New England have been referred to this study but when they have been re-tested in my lab their Residual Volumes are coming out lower and almost none of these patient have met this criteria. We have been asked why this is the case because they are now having difficulty finding patients that qualify for the study.
We have not been given access to the original PFT reports for these patients and have not been able to actually compare results on a case by case basis. For this reason we can only offer two possible reasons. First, that my lab may not be using the same reference equations for RV that other labs are. Second, that these patient’s RV’s may have been overestimated at other labs because of errors in testing.
To compare predicted RV’s I was able to find a dozen different reference equations for RV in adult males and females. These equations are mostly for Caucasian populations, but I was also able to find at least one reference equation each for Black, Asian, Indian, Iranian and Brazilian populations as well.
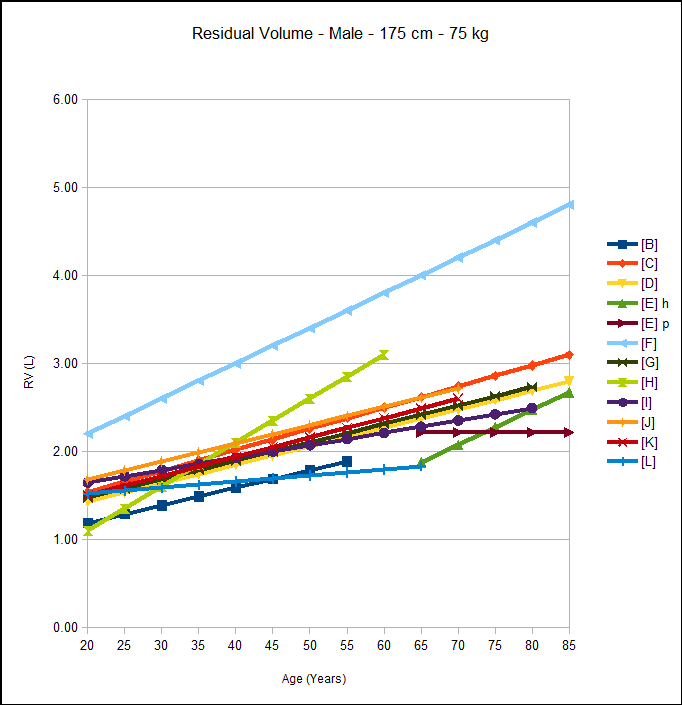
When the reference equations are graphed there are some immediately noticeable outliers. Some of these outliers make sense. For example Indians [L] and Asians [A][B] have been noted to have a lower FVC and a lower TLC than Caucasians by a number of investigators and this also appears to be the case for their respective RV reference equations.
The reference equations, [E]h [E]p, for an elderly subject group also appear to be outliers. I have seen this before in reference equations for spirometry and DLCO and I am not sure if it is an indication that the studies that include younger subjects do not analyze their data correctly (differences get smeared out when you analyze by simple linear regression) or whether the elderly subject group itself is an outlier. In this case, the results from helium dilution and plethysmographic lung volumes are at significant disagreement with each other and for this reason alone I consider these studies to be suspect.
I also suspect there may have been some typographical errors in the published Iranian reference equations [F] both because they are extreme outliers and because the Residual Volumes calculated from the equations don’t match the numbers discussed in the text of the article. I left this in however, because this is not the first time I have found typographical errors in published reference equations and it is yet another potential error source we should all be on guard about.
[Something we should all be concerned about is that we have limited ability to check on the reference equations used by our test systems. Who among us actually has a copy of Crapo’s original paper on lung volumes (Bull Eur Physiopathol Respir 1983; 18: 419-425)? I don’t, and have had to rely on articles that I can access that discuss it in detail and there’s no guarantee that transcription errors haven’t occurred somewhere along the way. Even when a source article is available on-line, it is often behind paywalls and who can afford to repeatedly pay $30-$50 per article just to check the dozens of reference equations on their test systems? Here’s a thought: why don’t the manufacturers of our test equipment include copies (PDF’s, of course) of all the articles their reference equations come from? They could get a bulk rate from the publishers and it would just be part of the cost of the test systems rather than having to come out of our operating budget.]
I am most concerned about the reference equation for Black males [H]. As far as I have been able to determine this is the only study ever performed regarding lung volumes other than FVC in blacks. It was based on a population of 77 black miners in England and lung volumes were estimated radiographically. This one study appears to be the primary basis for the assumption that the black predicted values for lung volumes are 12% less than Caucasians. The subjects were matched with Caucausians whose lung volumes were measured by the same technique so the 12% difference may be correct, but it is still an extremely limited subject population both in age, locale, profession and gender (no females).
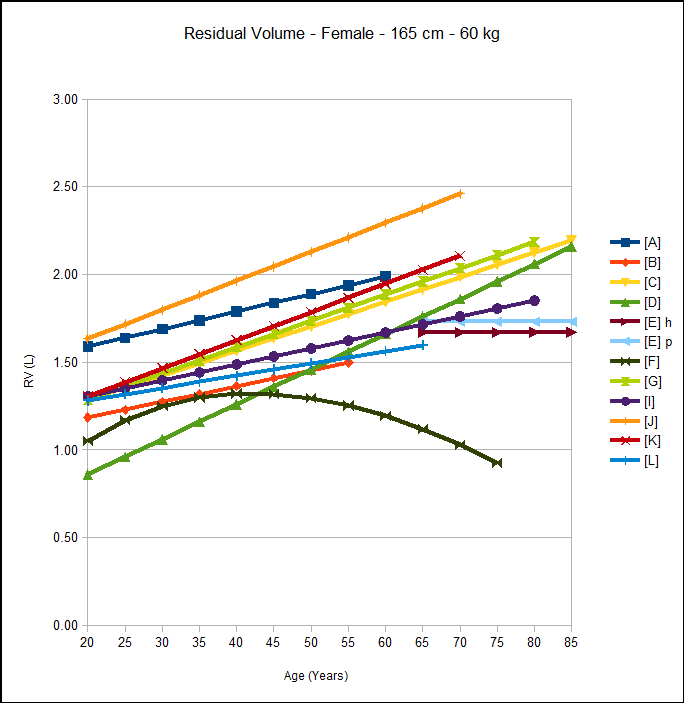
Looking solely at the remaining Caucasian reference equations, for males of average height and weight, the values are actually clustered fairly tightly. For adult males there is a range of 1.43 [D] to 1.68 L [J] at age 20 (~10%) and 2.48 [D] to 2.72 L [J] at age 70 (~6%). There is greater variance for the female reference equations, with a range of 0.86 [D] to 1.63 L [J] at age 20 (>40%) and 1.86 [D] to 2.46 L [J] at age 70 (>28%).
My lab uses [K] as our reference equation. This equation is recommended by the ERS and by extension, to some extent by the ATS. For both males and females throughout the age range, the values derived from this equation are pretty much in the middle of the pack. That doesn’t necessarily mean that it is more accurate, just that the difference between it and the other reference equations is about half the whole range. To me this means that regardless of which reference equations are used at other PFT Labs, the possible differences in predicted RV are likely to be small.
Having said that, predicted RV isn’t necessarily derived directly from a reference equation for RV. In looking at our test systems I was interested to note that predicted TLC is not derived from its own reference equation but from [predicted RV + predicted FVC]. This makes sense in a way because the predicted SVC derived from research into lung volumes will not likely match the predicted FVC. FVC has been studied in far more detail with much larger populations and its reference equations are far more likely to be accurate than those for SVC. In addition, a PFT report that showed different predicted values for FVC and SVC would be confusing and for this reason alone most everybody defaults to using the predicted FVC rather than a predicted SVC. However, it is just as easy to derive RV from TLC – FVC as it is to derive TLC from RV + FVC and I could argue that this is actually the more correct approach.
In my experience, patients find it much easier to perform the Inspiratory Capacity (IC) part of a vital capacity maneuver than the Expiratory Reserve Volume (ERV) part. The ERV part is more difficult and more uncomfortable and for this reason patients often terminate their exhalation earlier than they should. Since TLC = FRC + IC and RV = FRC – ERV this means that, in my opinion at least, the measurement of TLC and the reference equations for predicted TLC are more likely to be accurate than the measurement of RV and the reference equations for RV. For this reason it may actually be better to derive RV from TLC – FVC than to derive TLC from RV + FVC. Since I don’t know which test systems the prospective study patients had previously been tested on and since I don’t know how all manufacturers derive their predicted RV, I can’t say how closely our predicted RV actually comes to that of these patient’s prior tests.
The notion that TLC tends to be more accurate than RV leads me to the next possible reason for the discrepancy in percent predicted RV between my lab and other labs and that is that RV was overestimated when measured elsewhere. Since my lab is of course perfect in every way and a shining beacon of rectitude that means that our RV measurements are always exceptionally accurate and the results from all other labs are always suspect.
{Sigh}.
I wish that was the case but I think we probably have as many problems measuring lung volumes as everybody else does. I do think however, that we are always very aware of the problems that can be encountered during lung volume measurements. A fair amount of time is spent training new staff on the common problems with our test equipment and updating all staff when new problems are discovered. I also review most, if not all, of the raw data for the lung volume tests and correct the selected values whenever I think it is necessary. The selection of reported FRC and SVC values is often a judgment call that is not black and white but shades of gray and I will email a technician the reasons I made a change whenever I think they have made a choice I didn’t agree with. I’d like to hope that all of this means that our lung volume test results are at least as accurate as those from the best labs anywhere.
Accurate TLC and RV measurements have to start with an accurate FRC measurement. Any kind of a leak during a helium dilution or nitrogen washout test will cause FRC to be overestimated. When FRC is measured plethysmographically in the patient population (severe COPD) that are the prospective subjects for the study too fast a pant will cause FRC to be overestimated. When FRC is overestimated then RV will also be overestimated.
Even when FRC is measured accurately, an accurate RV depends on an accurate ERV measurement. Patients with severe COPD have difficulty with this part of the SVC maneuver in particular because underlying SOB will cause them to terminate exhalation early and because too fast of an exhalation can cause airway collapse and an increase in gas trapping (this is why SVC is often significantly larger than FVC in patients with COPD). When ERV is underestimated then RV will be overestimated.
Most errors, therefore, in performing lung volume measurements tend to lead to an overestimated RV.
Since we weren’t given access to these prospective study patient’s prior PFT reports, I cannot definitively answer why my lab tends to get a lower percent predicted Residual Volumes than other labs. I’d like to think it was solely because our testing quality is better, but that is vanity speaking and it could be just as well due to differences in the predicted RV. It was interesting to find out that our predicted TLC was derived from predicted RV and predicted FVC. This fact is not documented in the manual and it took some significant digging into our system’s software in order to find this out. I don’t necessarily blame the manufacturer for the lack of documentation since users are allowed to select numerous different reference equations and it is not possible to anticipate all possible selections, but I would like to have seen it easier to find this out.
Male adult RV reference equations data set:
| Source: | Number: | Ethnicity: | Age Range: | Height Range: | Technique: |
| [B] | 101 M+F | Chinese | 21-55 | N/A | He Dilution |
| [C] | 305 | Caucasian | 18-88 | 168 +/- 8 | He Dilution |
| [D] | 251 M+F | Caucasian | 15-91 | N/A | He Dilution |
| [E] h | 132 | Caucasian | 65-85 | 166 +/- 6 cm | He Dilution |
| [E] p | 132 | Caucasian | 65-85 | 166 +/- 6 cm | Pleth |
| [F] | 845 | Iranian | 6-85 | 114-190 cm | Pleth |
| [G] | 300 | Caucasian | 20-80 | Not reported | Pleth |
| [H] | 77 | Black | 34.9 +/- 11.9 | 177.9 +/- 7.4 | Radiographic |
| [I] | 50 | Brazilian | 20-80 | 155.5 – 185 cm | N2 Washout |
| [J] | 300 | Caucasian | 20-70 | 170 +/- 6.6 cm | Pleth |
| [K] | N/A | Caucasian | 18-70 | 155-195 | N/A |
| [L] | 760 M+F | Indian | 15-65 | N/A | N/A |
Male adult reference equations:
| Source | Equation: |
| [B] | (0.035 x height) + (0.020 x age) – (0.019 x weight) – 3.91 |
| [C] | (0.043 x height) – (0.012 x weight) + (0.024 x age) – 5.654 |
| [D] | (0.022 x height) + (0.021 x age) – 2.84 |
| [E] h | (0.02261 x weight) + (0.03978 x age) – 2.703 |
| [E] p | (0.0000003551 x height^3) + 0.315 |
| [F] | (0.011 x height) + (0.04 x age) – 0.521 |
| [G] | (0.020 x height) + (0.021 x age) – 2.443 |
| [H] | (0.0276 x height) + (0.05 x age) – 4.73 |
| [I] | (0.0197 x height) + (0.0141 x age) – 2.08 |
| [J] | (0.022618 x height) + (0.020664 x age) – 2.688 |
| [K] | (0.0131 x height) + (0.022 x age) – 1.23 |
| [L] | (0.019 x height) + (0.007 x age) – 1.945 |
Female adult RV reference equation data sets:
| Source: | Number: | Ethnicity: | Age Range: | Height Range: | Technique: |
| [A] | 197 | Asian | 17-56 | 142.2-175.3 cm | He Dilution |
| [B] | 101 M+F | Chinese | 21-55 | N/A | He Dilution |
| [C] | 286 | Caucasian | 18-88 | 156 +/- 7 cm | He Dilution |
| [D] | 251 M+F | Caucasian | 15-91 | N/A | N/A |
| [E] h | 189 | Caucasian | 65-85 | 152 +/- 6 cm | He Dilution |
| [E] p | 189 | Caucasian | 65-85 | 152 +/- 6 cm | Pleth |
| [F] | 642 | Iranian | 7-73 | 119-179 cm | Pleth |
| [G] | 327 | Caucasian | 20-80 | Not reported | Pleth |
| [I] | 50 | Brazilian | 20-80 | 145.2 – 175 cm | N2 Washout |
| [J] | 182 | Caucasian | 20-70 | 158 +/- 6.6 cm | Pleth |
| [K] | N/A | Caucasian | 18-70 | 145-180 cm | N/A |
| [L] | 760 M+F | Indian | 15-65 | N/A | N/A |
Female adult reference equations:
| Source | Equation: |
| [A] | (0.0224 x height) + (0.010 x age) – 2.307 |
| [B] | (0.020 x height) + (0.009 x age) – (0.016 x weight) – 1.336 |
| [C] | (0.023 x height) + (0.014 x age) – 2.790 |
| [D] | (0.020 x height) + (0.020 x age) – 2.84 |
| [E] h | (0.02266 x height) – 2.07 |
| [E] p | (0.01678 x height) – 1.039 |
| [F] | (-12.64 x age) + (12.821 x age^0.997) + (0.003 x height) – 0.77 |
| [G] | (0.020 x height (cm)) + (0.015 x age) – 2.314 |
| [I] | (0.0259 x height) + (0.0091 x age) – 3.15 |
| [J] | (0.01131 x height) + (0.01651 x age) – 0.562 |
| [K] | (0.0181 x height) + (0.016 x age) – 2.00 |
| [L] | (0.014 x height) + (0.007 x age) – 1.167 |
References:
[A] Ching B. Horsfall PAL. Lung volumes in normal Cantonese subjects: preliminary studies. Thorax 1977; 32: 352-355
[B] Chuan PS, Chia M. Respiratory function test in normal adult Chinese in Singapore. Singapore Med J 1969; 110: 265-271.
[C] Cordero PJ, Morales P, Benlloch E, Miravet L, Cebrian J. Static Lung Volume: Reference values from a Latin population of Spanish descent. Respiration 1999; 66: 242-250.
[D] Crapo RO, Morris AH, Clayton PD, Nixon CR. Lung volume in healthy nonsmoking adults. Bull Eur Physiopathol Respir 1983; 18: 419-425
[E] Garcia-Rio F, Dorgham A, Pino JM, Villasante C, Garcia-Quero C, Alvarez-Sala R. Lung volume reference values for women and Men 65-85 years of age. Am J Respir Crit Care Med 2009; 180: 1083-1091.
[F] Golshan M, Amra B, Soltani F, Crapo RO. Reference values for lung volumes in an Iranian population. Introuducing a new equation model. Arch Iranian Med 2009; 12(3): 256-261
[G] Gutierrez C, et al. Reference values of pulmonary function tests for Canadian caucasians. Can Respir J 2004; 6: 414-424.
[H] Lapp NL, Amandus HE, Hall R, Morgan WKC. Lung volumes and flow rates in black and white subjects. Thorax 1974; 29: 185-188.
[I] Neder JA, Andreoni S, Castelo-Filho A, Nery LE. Reference values for lung function tests. I. Static Volume. Braz J Med Biol Res 1999; 32: 703-717
[J] Roca J, et al. Prediction equations for plethysmographic lung volumes. Respir Med 1998; 92: 454-460.
[K] Stocks J, Quanjer PH. Reference values for residual volume, function residual capacity and total lung capacity. Eur Respir J 1995; 8: 492-506.
[L] Upwadia FE, Sunavala JD, Shetye VM. Lung function studies in in healthy Indian subjects. J Ass Phys India 1987; 36: 491-496

PFT Blog by Richard Johnston is licensed under a Creative Commons Attribution-NonCommercial 4.0 International License.