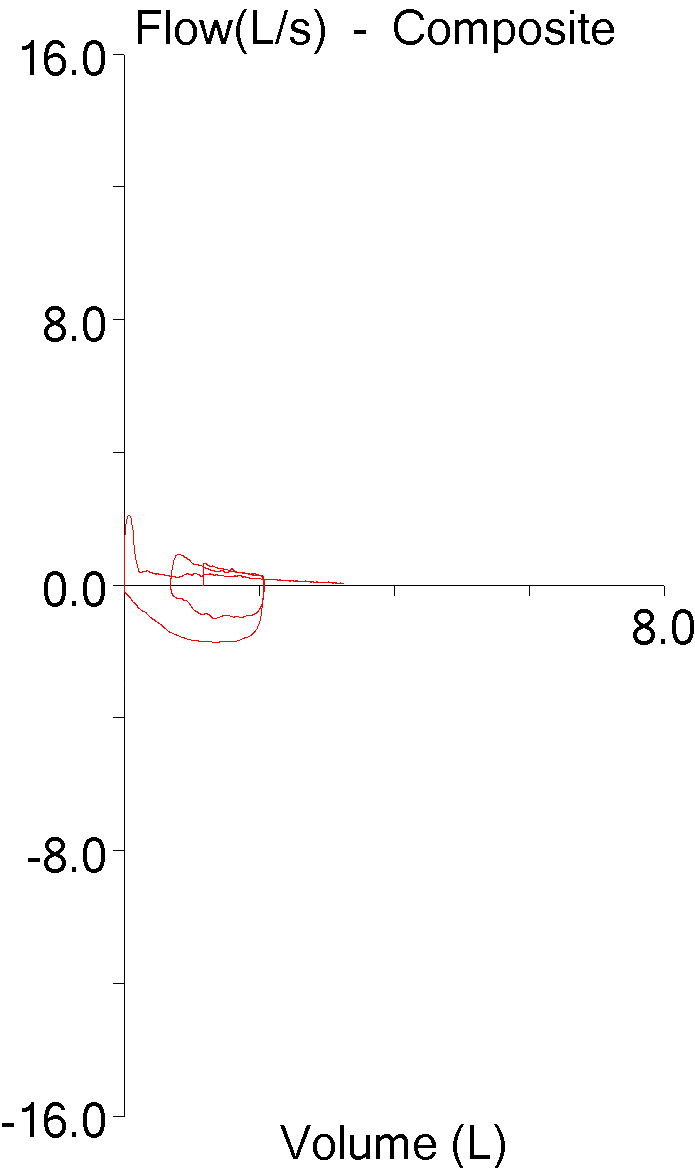
I’ve been planning on putting together a tutorial on characterizing and interpreting the contours of flow-volume loops so I’ve been accumulating flow-volume loops that are examples of different conditions. Lately I was reviewing some of them and noticed that when I tried to compare loops from different individuals with similar baseline conditions that the different sizes of the flow-volume made this difficult. For example, these two loops are both from individuals with normal spirometry.
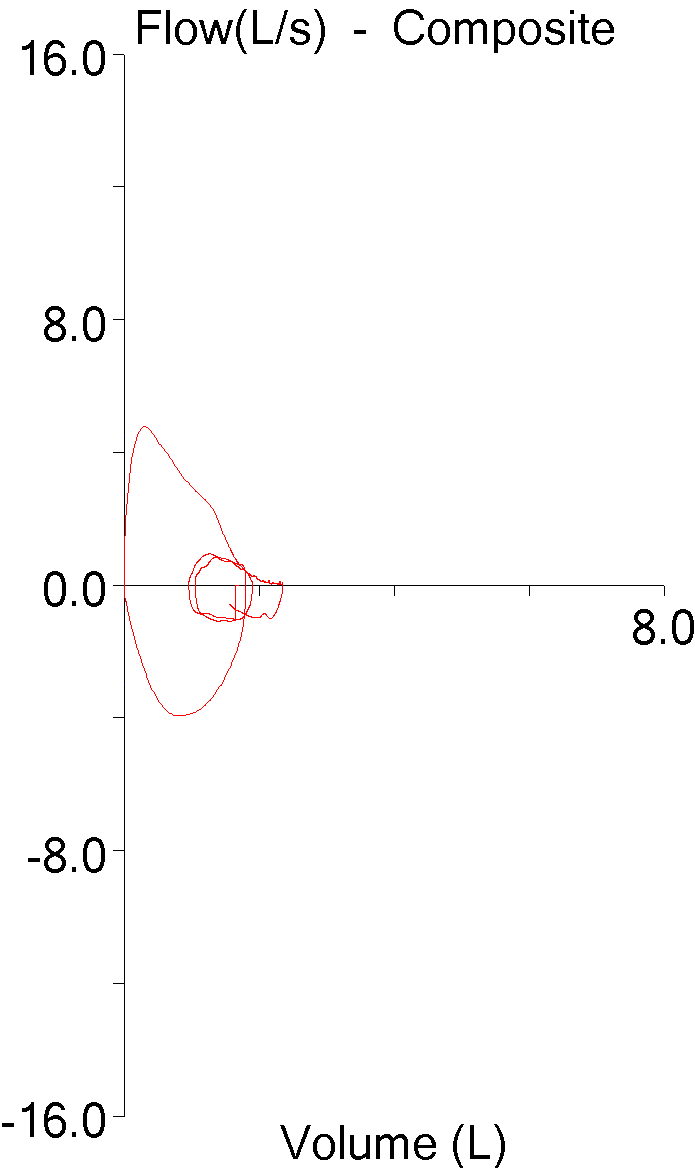
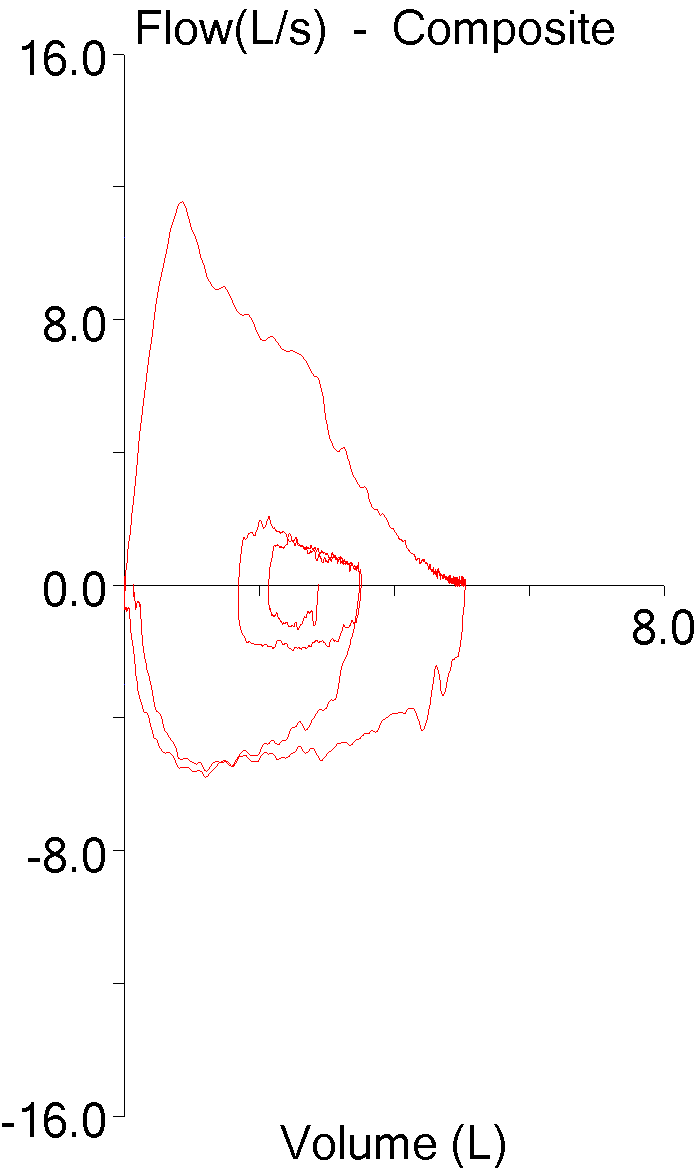
One is from short, elderly female and one is from a tall, young male. If all you had to look at was the flow-volume loops, you might think that the smaller loop was abnormal, but the larger loop actually comes from a spirometry effort with an FVC that was 92% of predicted while the smaller loop’s FVC was 113% of predicted. The difference in sizes of these loops is of course due to the difference in age, gender and height between these individuals but also because of settings we’ve made in our lab software and because of the ATS/ERS spirometry standards.
Our lab software will allow us to display and print flow volume loops in only one of four sizes:
- 2 L x 4 L/S
- 4 L x 8 L/S
- 6 L x 12 L/S
- 8 L x 16 L/S.
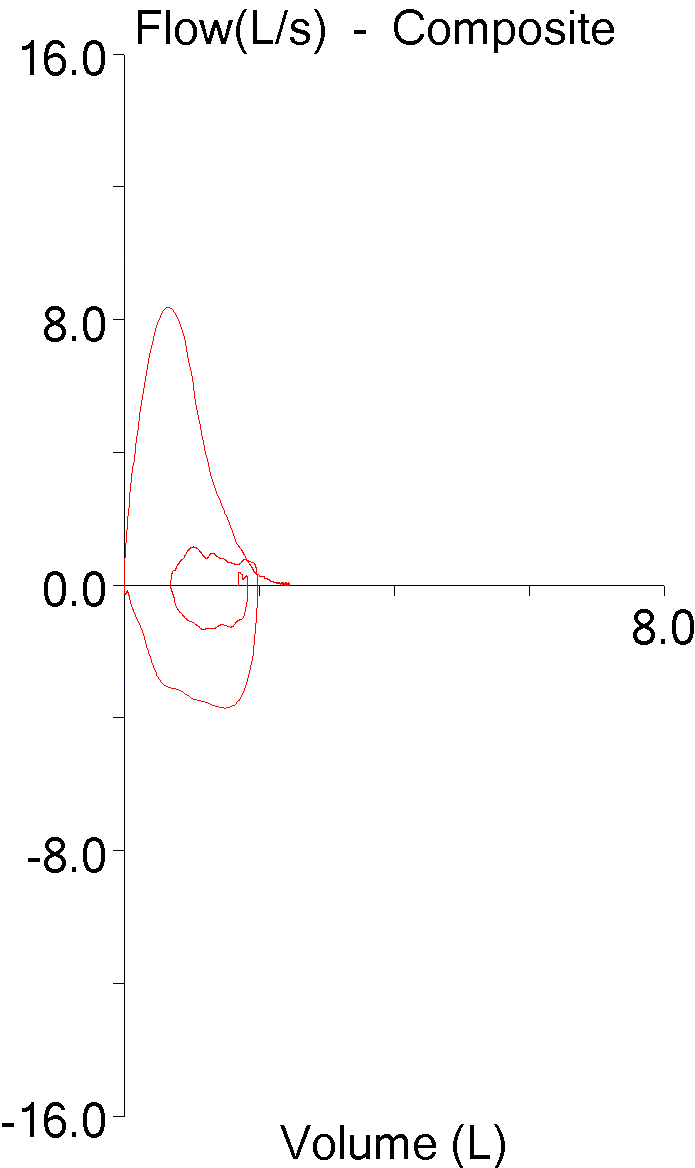
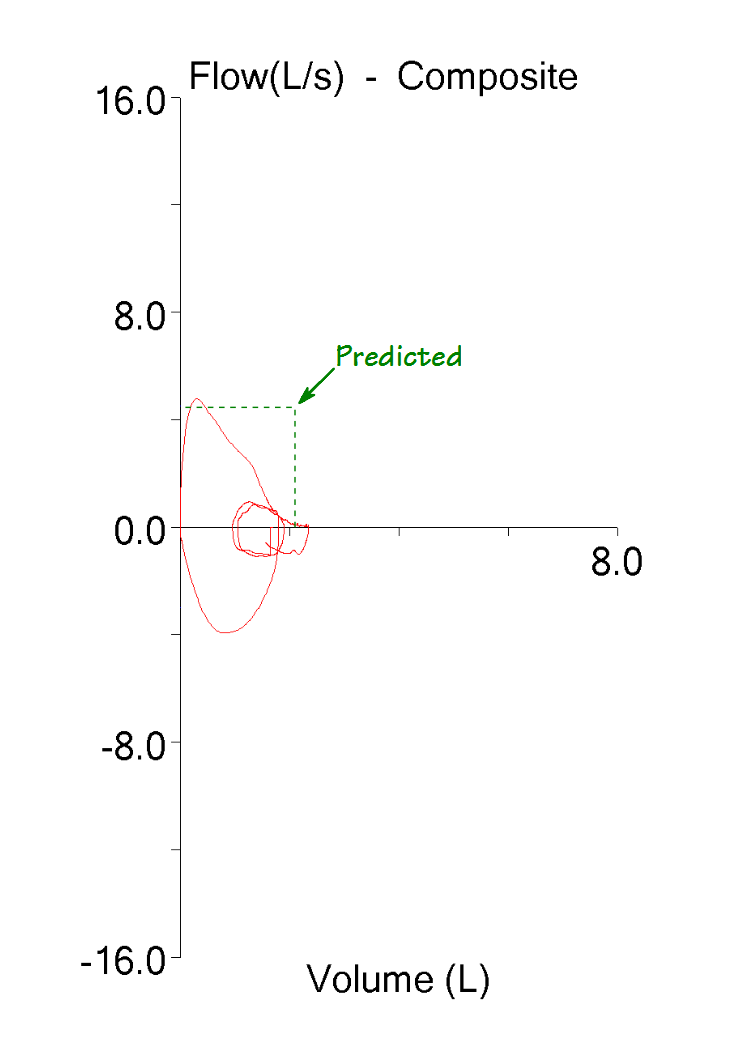
There is an option that lets the software automatically select the scale but we decided to mandate the 8×16 format for all flow-volume loops. One reason we did this is that most of the pulmonary physicians were used to working with just a single scale and found it difficult to adjust when the scale kept changing. Another reason however, was that we found that the software made the decision about which scale to use based on the FVC, not on the peak flow. This caused some flow-volume loops to get chopped off:
Admittedly our decision to go with an 8×16 format was made at least 15 years ago but rightly or wrongly the one thing we’ve never gotten a complaint or question about was the scale used to report flow-volume loops.
So why is the flow-volume loop displayed the way it is? As so many things are it is actually the result of somewhat arbitrary decisions. When I first acquired a spirometry system in the mid-1970’s that was capable of performing flow-volume loops there were no particular standards for the way they were supposed to be reported and the X-Y recorder that came with the system allowed us to select which axis was which, which direction was which and the amplitude in both the X and Y directions. The most common convention at that time was to have volume on the X-axis with exhalation on the top and inspiration on the bottom but in some research papers the loop was on its side with flow as the X-axis. Having TLC (maximum inhalation) on the left side and RV (maximum exhalation) on the right side of the loop was also the most common convention but again a fair number of research papers showed it the other way around. We ended up reporting flow-volume loops oriented the same they are now, but we chose a 1:1 scale for flow and volume (hey, it made sense to us at the time) so for a number of years our flow-volume loops were very, very tall.
By the mid-1980’s however, standards had been set not only for the exhalation-inhalation and TLC-RV directions, but for a ratio of 2:1 for flow and volume and this is what has led to the limited number of scales that our lab software has for printing flow-volume loops.
Note: I’ve tried to track down the origins of the 2:1 ratio between flow and volume and couldn’t find anything specific. The 1983 ACCP spirometry recommendations are mute on any technical specifications whatsoever. The 1987, 1995 and 2005 ATS and ATS/ERS standards all mandate the 2:1 ratio, but this is not attributed to any source. Playing around with different scales I’ve found that 2:1 tends to optimize the ability to recognize contour. A 1:1 ratio smears contour in the vertical direction and 4:1 smears it in the horizontal direction and in both of these directions contour quickly become unrecognizable.
So what’s wrong with reporting flow-volume loops this way? Well, standardization is great and I am a big fan of it but in this case I was trying to find a way to normalize flow-volume loop contours across a wide range of heights, ages and genders. After thinking about this for a while it occurred to me that the best way to do this was to get rid of liters and liters/second and instead use percent of predicted for volume and flow.
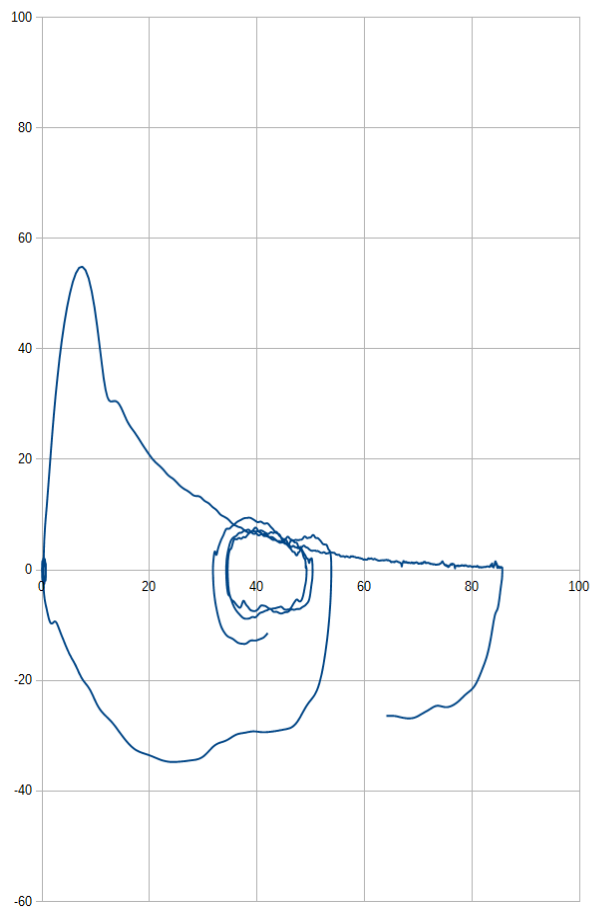
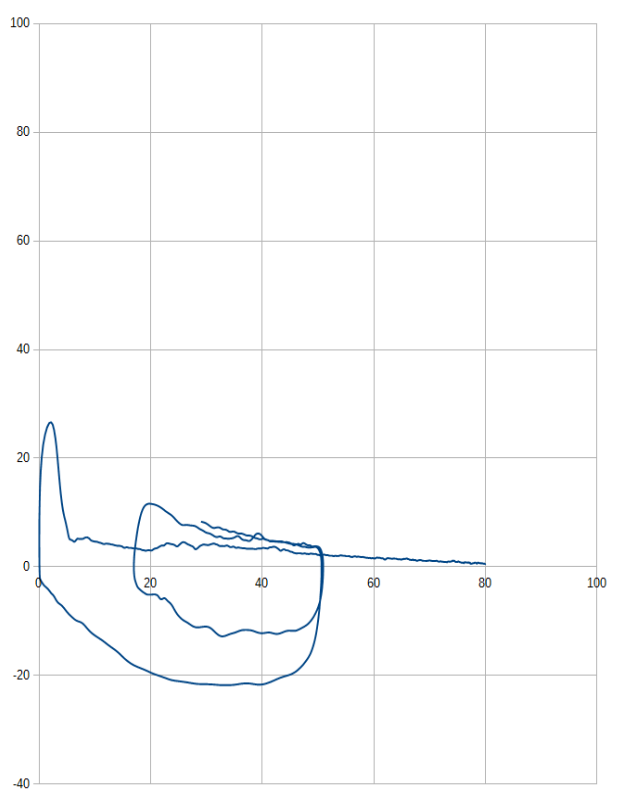
My lab’s software lets me download the flow and volume data for specific spirometry efforts and by uploading this data into a spreadsheet and then fiddling with it a bit I found I was able to re-scale flow-volume loops using percent of predicted. When I did this, I found the loops to actually be a lot more informative than when they are reported as liters and liters/second. Here are the “normal” loops from above re-scaled as percent of predicted:
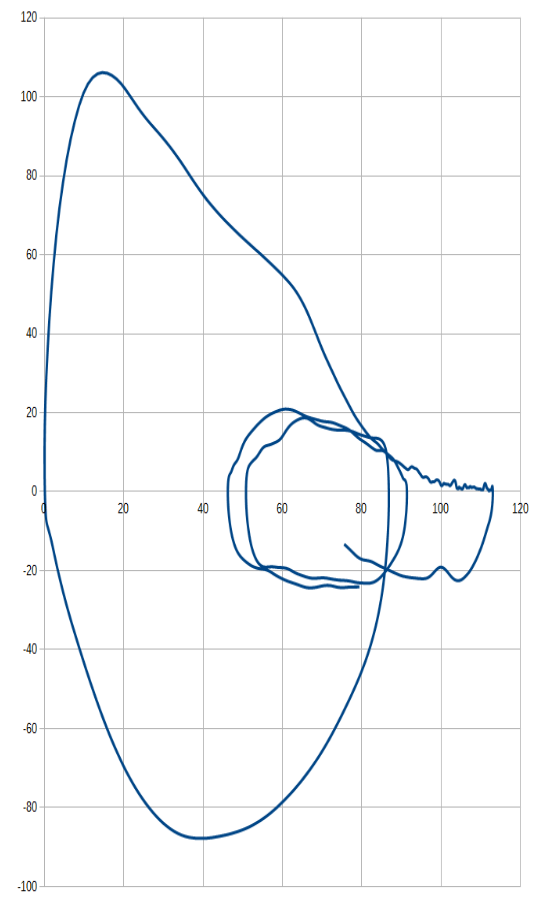
FVL from short, elderly female
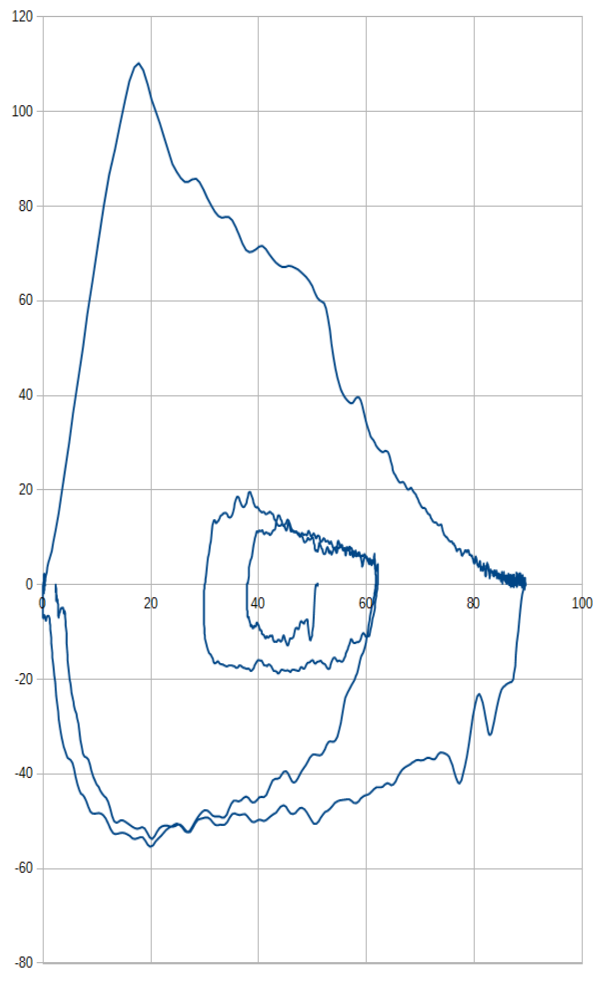
FVL from tall, young male
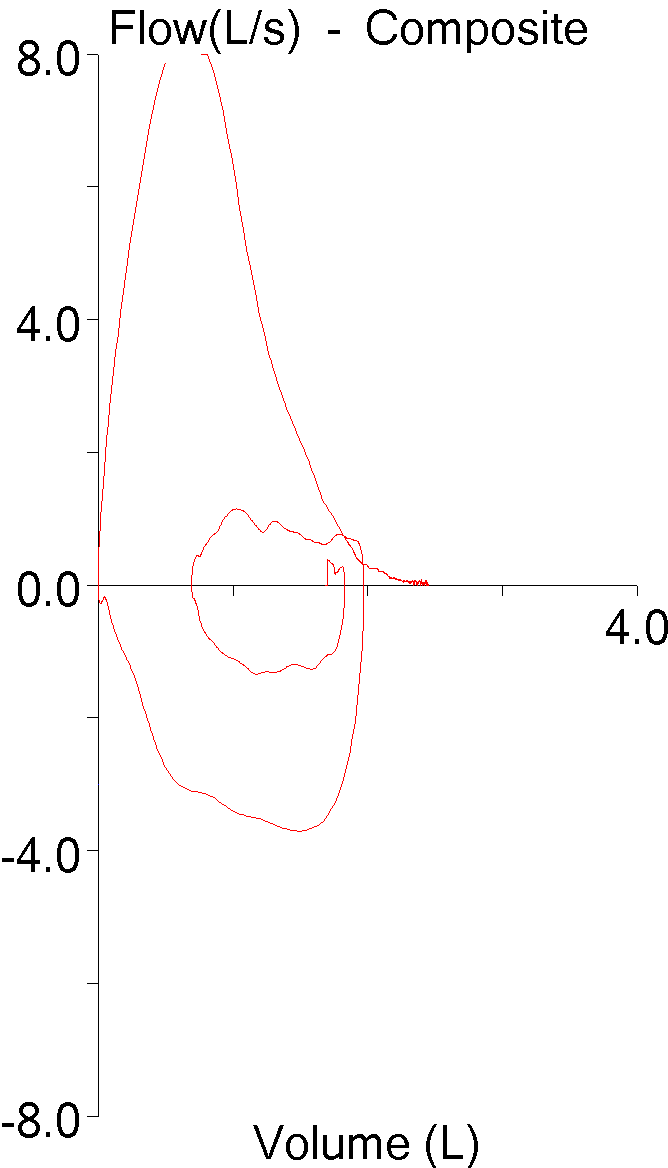
And here’s the other spirometry effort:
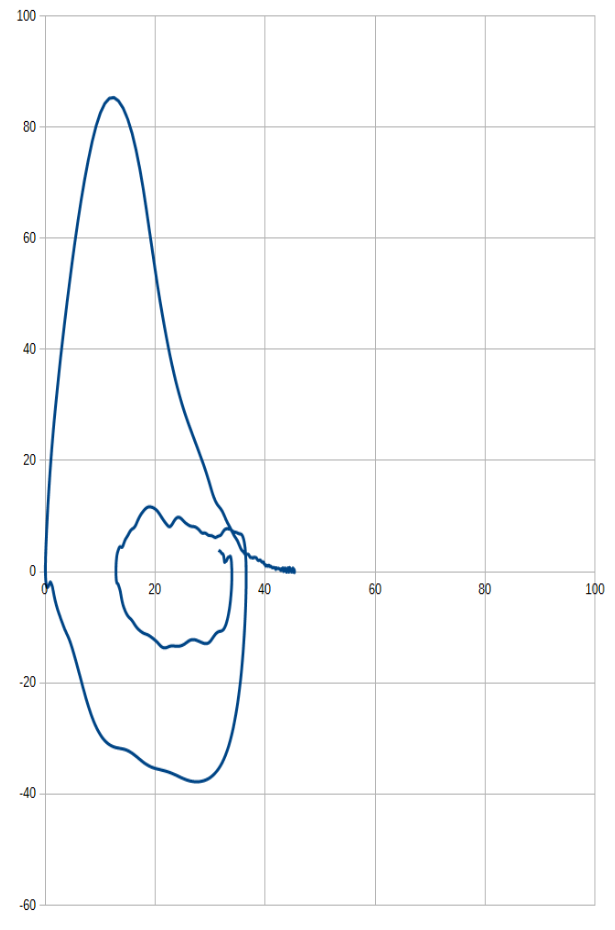
And here’s another spirometry effort with moderately severe airway obstruction (FEV1 56% of predicted):
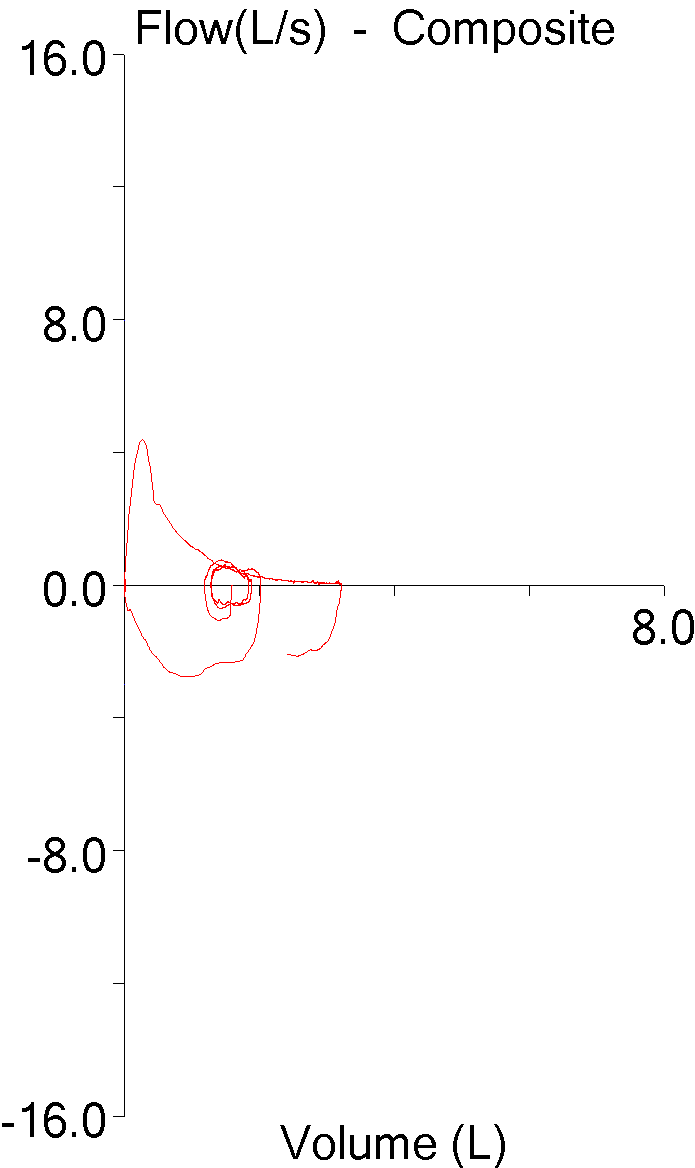
And finally one more with very severe airway obstruction (FEV1 28% of predicted):
Re-scaling flow-volume loops using percent of predicted makes it immediately evident whether the FVC and PEF are normal or not while at the same time bringing the contour of the loop to the forefront. Yes, all loops are reported in the “same” size, but I found it to be an easy conceptual shift to think about flow and volumes as a percent of predicted rather than as liters and liters/second and didn’t find this to be a problem at all.
And yes, the same percent predicted information could be added to conventional flow-volume loops, but I didn’t find this nearly as informative.
Does re-scaling flow-volume loops preserve the 2:1 PEF/FVC ratio mandated by the ATS/ERS standards? Close, but not exactly.
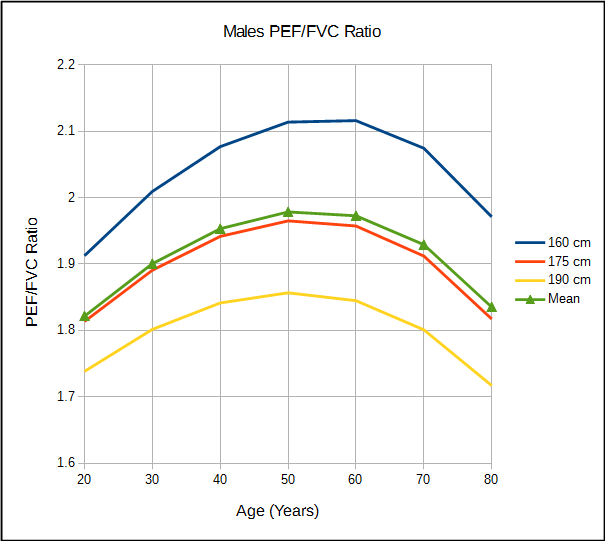
PEF/FVC ratio using NHANESIII Caucasian Male Reference Equations
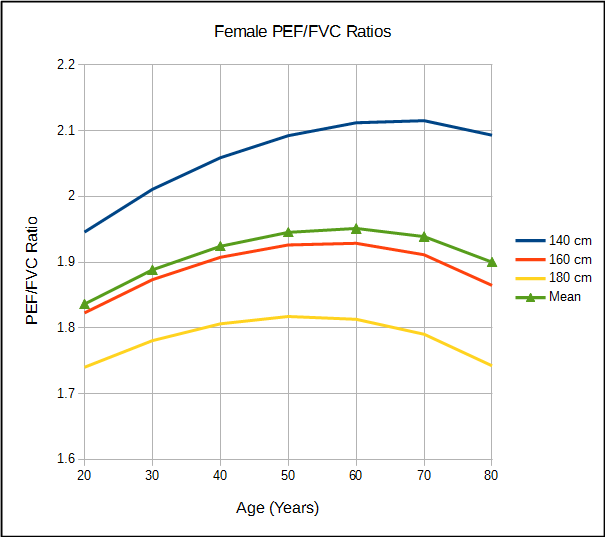
PEF/FVC ratio using NHANESIII Caucasian Female Reference Equations
Note: I found the curves in these graphs to be very interesting. They are in part an artifact of the units involved (liters and liters/second) but I still wonder what they may be saying about spirometry and age and height.
But a good question would be whether the 2:1 ratio is actually optimal. 2:1 was probably chosen because its ability to emphasize the flow-volume loop contour was reasonably correct but as importantly, it was easy to implement. At the moment at least, I would argue that re-scaling flow-volume loops using the percent of predicted does at least a good a job at emphasizing the flow-volume loop contour as the 2:1 ratio. I would also say there’s nothing magical about the 2:1 ratio nor do all loops need to be reported with the same ratio as long as the contour is preserved.
The downside of reporting flow-volume loops this way is that they are then tied to a specific set of reference equations. Clinically however, I don’t have a problem with this at all. Flow-volume loops would be reported using the same reference equations that are used to report the spirometry results numerically, so what’s the difference?
I will admit this idea needs more study. I am interested to see what flow-volume loop contour characteristics are preserved (or aren’t) across different heights and ages when the same percent of predicted numerical values are present. At some point I’ll probably find out since I am going to continue collecting different flow-volume loops and when I create the tutorial on flow-volume loop contours I will most probably be using percent of predicted scaling.
So my proposal is that flow-volume loops should be reported using percent of predicted rather than liters and liters/second. The value of this is that it increases the information density of the reported flow-volume loop and it does this by emphasizing the contour of the flow-volume and makes its “normalacy” (or lack thereof) more apparent without decreasing its readability in any way.
I’ve had some discussions lately with people from different areas of the PFT field about reports and one of the issues has been the need to improve their readability. Flow-volume loops are informative to us but this is mostly due to familiarity and not due to their inherent readability. The standards for reporting flow-volume loops have not changed for well over 30 years and they originated at a time when the fidelity of a represented signal was of primary importance. Data fidelity is still important but at the same time it’s become significantly more important for the information embedded in the data to be meaningfully transmitted to a much larger audience. I wasn’t thinking about these things when I re-scaled flow-volume loops using percent of predicted; I was just trying to normalize them across different ages, heights and genders for teaching purposes. It may well be that re-scaling them in this way is still not the best way to improve readability but I hope that it at least stirs up some interest in this topic.
So, are there any policy makers listening? Any equipment manufacturers? Just curious.
References:
ACCP Scientific Section. Statement on spirometry. Chest 1983; 83(3): 547-550
Brusasco V, Crapo R, Viegi G et al. ATS/ERS Task Force: Standardisation of lung function testing. Standardisation of spirometry. Eur Respir J 2005; 26: 319-338
Standardization of spirometry – 1987 Update. Am Rev Respir Dis 1987; 136: 1285-1298.
Standardization of spirometry – 1994 Update. Am J Respir Crit Care Med 1995; 152: 1107-1136.

PFT Blog by Richard Johnston is licensed under a Creative Commons Attribution-NonCommercial 4.0 International License
Hey Richard,
What a great idea!
I have the same software. Could you provide step-by-step instructions to do what you do?
And a question. Can the report be modified to print out percent predicted loops, or is it necessary to print your technique separately?
Best,
Ira
Ira –
First you have to get the patient’s predicted FVC and PEF {4.52, 9.69}. After copying the data from the spirometry module I paste it into a spreadsheet where it forms two columns (A = volume, B = flow). I then create two new columns. In the first I use the MIN() function to find the lowest volume (the zero offset), which I then subtract from the current volume, divide by the predicted FVC and then multiply by 100 to get %pred {for example =((A1-min(A$1:A$4000)/4.52)*100}. The second column is easier, since the flow signal already has a zero offset (i.e. zero) so {=(b1/9.69)*100}. Take the two new columns which are now volume and flow in percent predicted, select them and use the graph function to build a scatter diagram (comparing x-y pairs) and rest is just formatting the graph so it looks pretty. Squaring it (making sure the x and y axes have equal dimensions) is more complicated since the spreadsheet software I use doesn’t allow me to specify graph dimensions (I have to use an external graphics program) but going by eye should be close enough to start with.
There’s no lab software that I know of that will print FVL’s in terms of percent predicted and I suspect that manufacturers may be hesitant to offer this as an option because it is not in the ATS/ERS standards (and in fact the ATS/ERS standards mandate liters and liters/second in a 2:1 ratio).
I’ve done this often enough that it takes me less than 5 minutes from start to finish (including squaring the dimensions). That’s okay for teaching and research but not really for clinical use. I will email you a completed spreadsheet so you can see what this looks like.
Regards,
Richard
Once again thank you for simple food for thought exercise you did. You may be right and indeed it may be more informative. Not necessarily to us that we are familiar but to the patient him/herself when you are explaining the flow volume loop. I will look into patient satisfaction/understanding if i can fiddle with it and le you know.
Thanks again
Stelios