My medical director and I had a discussion today about where the cutoff for a normal FEV1/FVC ratio would be for a 93 year old patient of his. Part of the problem is that there are almost no reference equations for patients this age and the best you can usually do is to extrapolate. Another part is that anybody in their 90’s is a survivor and must have had good lung function throughout their life to reach that age, which means that they aren’t average so it’s not clear how well extrapolation actually works in this population. The final part is that the guidelines for PFT interpretation that are used by my lab were put into place about 40 years ago and reflect the thoughts at that time. I updated part of the guidelines with the 2005 ATS/ERS interpretation algorithm about 10 years ago, but the thresholds for normalcy (as well as the reference equations we use) still haven’t changed all that much. I’ve brought this issue up a number of times over the years (usually every time I get a new medical director) but haven’t gotten a consensus from the pulmonary physicians on either the need for change or for what threshold values should be used.
Anyway, both my medical director and I felt felt that the LLN for the FEV1/FVC ratio (when viewed as a percent of the predicted FEV1/FVC ratio) is probably lower for a 75 year old (and certainly for a 93 year old) than it is for a 25 year old, and that the current lab guidelines for interpretation were probably diagnosing airway obstruction in the elderly more often than they should. My lab currently uses the NHANESIII reference equations for spirometry however, and I wasn’t sure they showed this particularly well since the equations for the FEV1/FVC ratio and its LLN are quite simplistic compared to those for FVC and FEV1.
The NHANESIII reference equations were published in 1999 and at that time they were derived from the largest population that had ever been studied (7428 subjects, 40.9% male, 59.1% female) and with the most sophisticated statistical analysis that had been used up until that time. In 2012 however, the Global Lung Function Initiative (GLI) released a set of reference equations using data obtained from 73 centers world-wide on 97,759 subjects (44.7% male, 55.3% female). Statistical analysis of the GLI data was performed using the Lambda, Mu, Sigma (LMS) approach and a set of equations were derived that covered ages 3 to 95.
I have some reservations about how well the GLI equations match the population served by my lab but it’s a moot point whether I like them or not since even now, 5 years after the GLI equations were published, my lab’s software has not been updated to include them. The reason for this is that the GLI spirometry equations use what are called “splines” to generate the spirometry reference values and these are taken from a look-up table. My lab’s software does have an equation editor but it will not accommodate lookup tables so the GLI equations can’t be added. I’m sure our equipment manufacturer could get around this if they really wanted to, but so far it hasn’t happened.
I do have a lot of respect for the GLI equations however, and think that the overall view they give of the normal distribution of FVC, FEV1 and the FEV1/FVC ratio is far more correct than those of any prior studies. Using a spreadsheet tool downloaded from the GLI that lets me generate the GLI spirometry predicted values and the NHANESIII reference equations I decided to take a closer look at their predicted FEV1/FVC ratios and their LLNs.
The GLI FEV1/FVC ratios and their LLNs trace out curves that generally decline with age while the NHANESIII FEV1/FVC ratio and LLN trace out straight lines. A quick look at the NHANESIII FEV1/FVC ratio reference equations (this example is for Caucasian males):
![]()
![]()
would give you the impression that the LLN is always going to be factor of roughly 0.89 (i.e. 78.388 / 88.066) of the FEV1/FVC ratio and while that’s true:
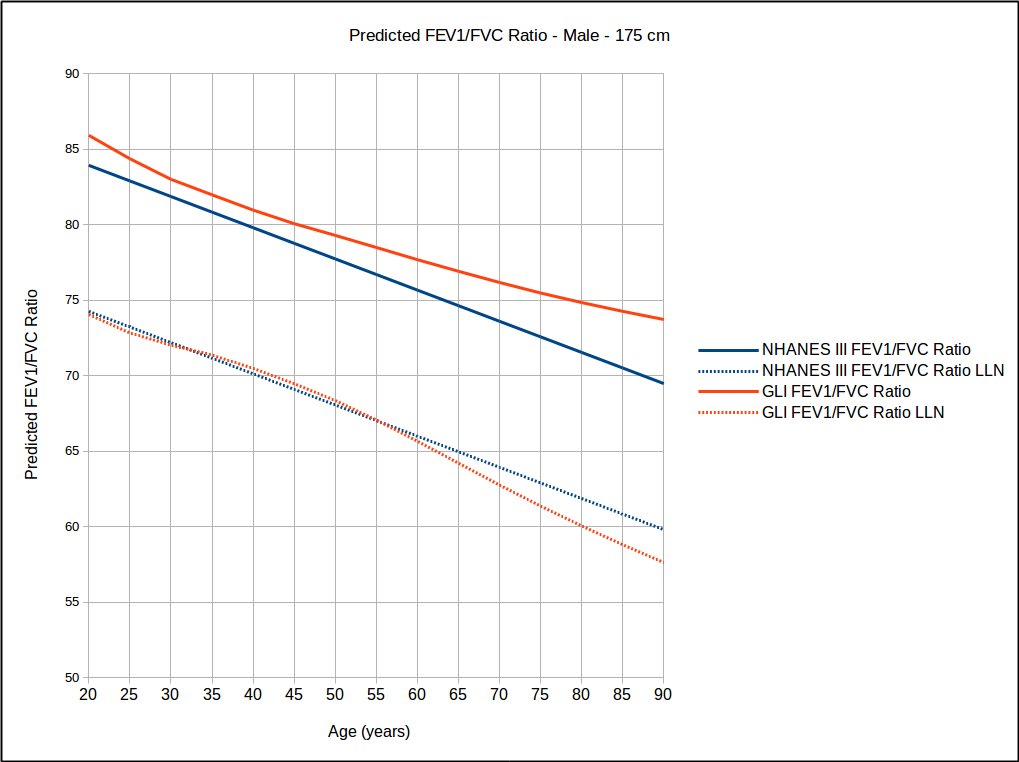

when you look at the LLN as a percent of the predicted FEV1/FVC ratio (LLN PP) for the NHANESIII equations they actually decline slightly with age.
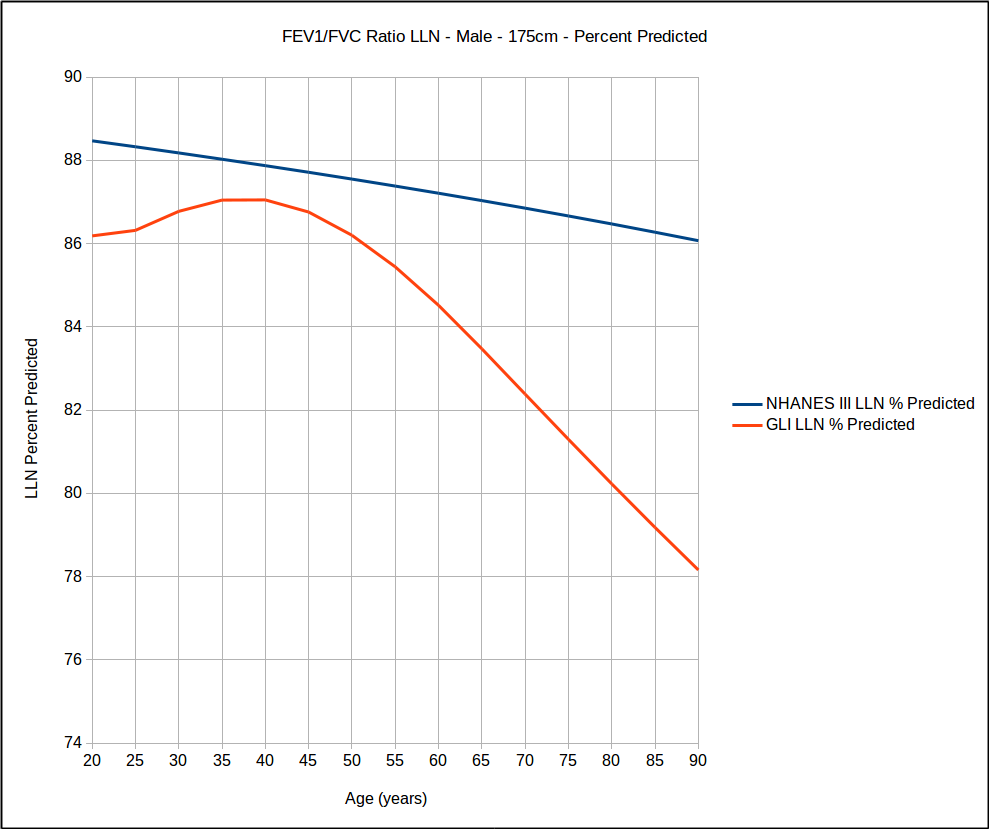
The behavior of the GLI LLN PP is more complex (and far more interesting). The LLN PP is negatively curved up to about age 50 (although any change is less than 1% over that range) and then starts decreasing with increasing age, and this decrease is reasonably linear.
I think that the curves described by the GLI equations are probably far more correct than straight lines described by the NHANESIII equations. This is partly because the GLI study population is significantly larger (and more diverse) than the NHANESIII study but also because the GLI statistical analysis is significantly more sophisticated than NHANESIII.
It should be remembered that the LLN is based on the variability of the underlying data so in a sense what the GLI curve is saying is that above age 50 the FEV1/FVC ratio becomes more variable. That’s okay and it’s probably a reflection of how variable the effects of aging are on us. Not everybody ages at the same rate and not all of the organs in our body age at the same rate either.
Regardless of whether you look at the NHANESIII equations or the GLI equations what is abundantly clear is that using a fixed percent of predicted as the threshold for normalcy (which is what my lab uses) is not correct at any age since the both NHANESIII and GLI show that the LLN PP changes with age. What’s also clear is that probably too many of my lab’s elderly patients are being diagnosed with airway obstruction they probably don’t have and this needs to change.
The FEV1/FVC ratio and its LLN is the starting point of the ATS/ERS interpretation algorithm so defining the LLN correctly is critical. The GLI reference equations make it quite clear that the LLN is not linear but viewing the FEV1/FVC ratio LLN by itself does not make its complexity as apparent as when it is viewed as a percent of the predicted FEV1/FVC ratio. I still have reservations that the GLI predicted FVC and FEV1 are a good match to my lab’s patient population but I think the overall behavior of the FEV1/FVC ratio’s LLN as described by its percent predicted is not only reasonably accurate, but that it is more accurate than the LLN from the NHANESIII or any other spirometry reference equations. For this reason I have no particular problem combining the GLI FEV1/FVC ratio’s percent predicted with the NHANESIII reference equations (not that I have a real choice since my lab’s software does not support the GLI reference equations).
I’m hoping that sharing the GLI FEV1/FVC ratio LLN percent predicted graphs with the department’s physicians will help to move us forward towards updating our interpretation guidelines. One probable sticking point is that many of the department’s physicians were taught relatively simplistic approaches towards interpreting spirometry using percent predicteds and rules like 80-60-40 (weren’t we all?). A variable FEV1/FVC ratio LLN percent predicted makes it clear that simple rules are no longer possible (but then anybody who’s been paying attention to the literature knows that simple rules were put to rest a while ago).
An additional problem is that a change in our interpretation guidelines means that going forward there will be a significant discontinuity in our interpretations, more so than for just changing reference equations. This should never be a reason not to go forward however, since improving the accuracy of interpretations is more important than continuity.
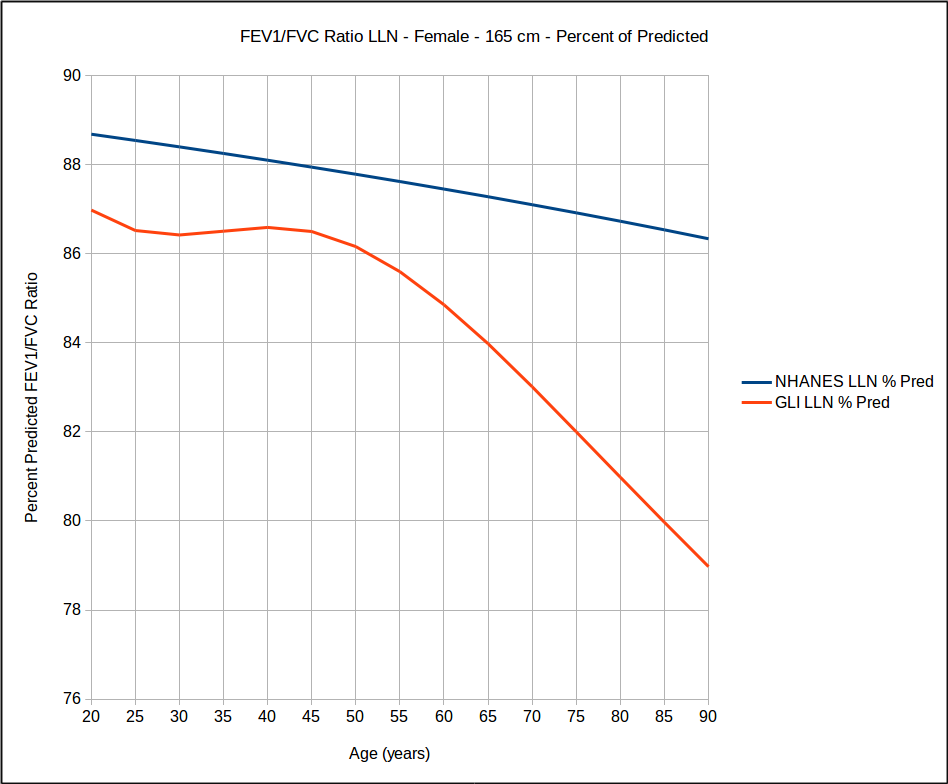
There’s no straightforward way to use the GLI FEV1/FVC ratio LLN percent predicted in our interpretations. I haven’t explored the differences in the LLN PP across different heights and ethnicities so it’s not clear how universal the graphs I’ve included here really are and that will have to be investigated at some point. At the moment the only workable I idea I’ve come up with is to use either graphs or tables of the LLN PP as part of the interpretation process and to manually insert the LLN PP into the report notes. Not elegant and a bit of extra effort, but it should work.
References:
Hankinson JL, Odencrantz JR, Fedan KB. Spirometric reference values from a sample of the general U.S. population. Am J Respir Crit Care Med 1999; 159: 179-187.
Gaunger PH, Stanojevic S, Cole TJ, Baur X, Hall GH, Culver BH, Enright PL, Hankinson JL, Ip MSM, Zheng J, Stocks J. ERS Task Force. Multi-ethnic reference values for spirometry for the 3-95 age range: the global lung function 2012 equations. Eur Respir J 2012; 40: 1324-1343.

PFT Blog by Richard Johnston is licensed under a Creative Commons Attribution-NonCommercial 4.0 International License
Hi,
Richard do you use Vmax? Have successfully got the GLI reference set on there without look up tables, on an older version of Vmax running on XP. I have checked with the GLI tool and it all works.
There is a publication supplement to GLI which explains how to do this with equipment with limited memory.
http://erj.ersjournals.com/content/erj/suppl/2013/04/19/09031936.00080312.DC1/Supplement_GLI_2012_predicted_values-2.pdf
Of interest to you, should be the ethnicity variants are simply an applied correction factor to the Caucasian reference set, so once you have that in its straight forward (you just need to apply each correction for each measure). In the above publication this is seen in table E4, the exponents for race are independent of height or age. So for instance SE Asian is EXP -0.0881 = 0.915, so this the correction value applied for FEV1 is SE Asians in that example. I can not take credit for understanding this simple rule, or rearranging the equations to fit Vmax (several are needed to cover different age ranges that make up the polynomial shape) but once explained it made sense.
Regards
Andrew