The use of Z scores to report PFT results, both clinically and for research is occurring more and more frequently. Both the Z score and the Lower Limit of Normal (LLN) come from the same roots and in that sense can be said to be saying much the same thing. The difference between the two however, is in the emphasis each places on how results are analyzed. The LLN primarily emphasizes only whether a result is normal or abnormal. The Z score is instead a description of how far a result is from the mean value and therefore emphasizes the probability that a result is normal or abnormal.
Reference equations are developed from population studies and the measurements that come from these studies almost always fall into what’s called a normal distribution (also known as a bell-shaped curve).
 A normal distribution has two important properties: the mean value and the standard deviation. The mean value is essentially the average of the results while the standard deviation describes whether the distribution of results around the mean is narrow or broad.


The simple definition of the Z score for a particular result is that it is the number of standard deviations that a result is away from the mean. It is calculated as:
![]()
For mathematical reasons 68% of the results in a normal distribution fall within ±1 standard deviation from the mean and 95% of the results will fall within ±2 standard deviations from the mean (and 99.7% of results will fall within ±3 standard deviations). Although in some respects it is an arbitrary decision, research on many different biological processes has shown that the 5% of results that are 2 standard deviations away from the mean are usually abnormal. For this reason a Z-score of > ±2 means a specific result is probably abnormal.
Elevated pulmonary function results are usually not considered abnormal however. This is because having an FVC or FEV1 that is abnormally high may be physiologically abnormal but clinically it is not. Pulmonary function results from the bottom 5% are therefore considered abnormal, not the bottom 2.5% and top 2.5%. Again for mathematical reasons, the bottom 5% of results will occur at a Z-score of -1.645 and strictly speaking the value represented by a Z-score of -1.645 and the LLN are the same thing.
Obviously some care must be taken in selecting which results from a population study are analyzed for mean and standard deviation. If, for example, the spirometry results from both males and females were analyzed as one group this would of course affect both the mean and the standard deviation. The effect of this would likely be that more females who are clinically normal would be considered abnormal and more males who are clinically abnormal would be considered to be normal.
For this reason the results from large population studies are divided into subgroups and each subgroup will have its own mean and standard deviation. This is also where reading the fine print is important since the decisions on how a study population is subdivided has significant implications on the statistical results.
Subdividing by gender is relatively straightforward (although it should be remembered that depending on how you define it between 1 in 1000 and 1 in 2000 babies are born with intersex characteristics) but subdividing by ethnicity is much more difficult, particularly since there is no clear definition for ethnicity. There is also a limit on how far subdividing makes sense since depending on the value being measured and the size and composition of a subgroup results may no longer fit a normal distribution.
But an opposite problem can occur when results aren’t subdivided enough. I am not a statistician but I am concerned when I see an LLN that is as an offset of the mean that was determined using the standard deviation from an entire group.
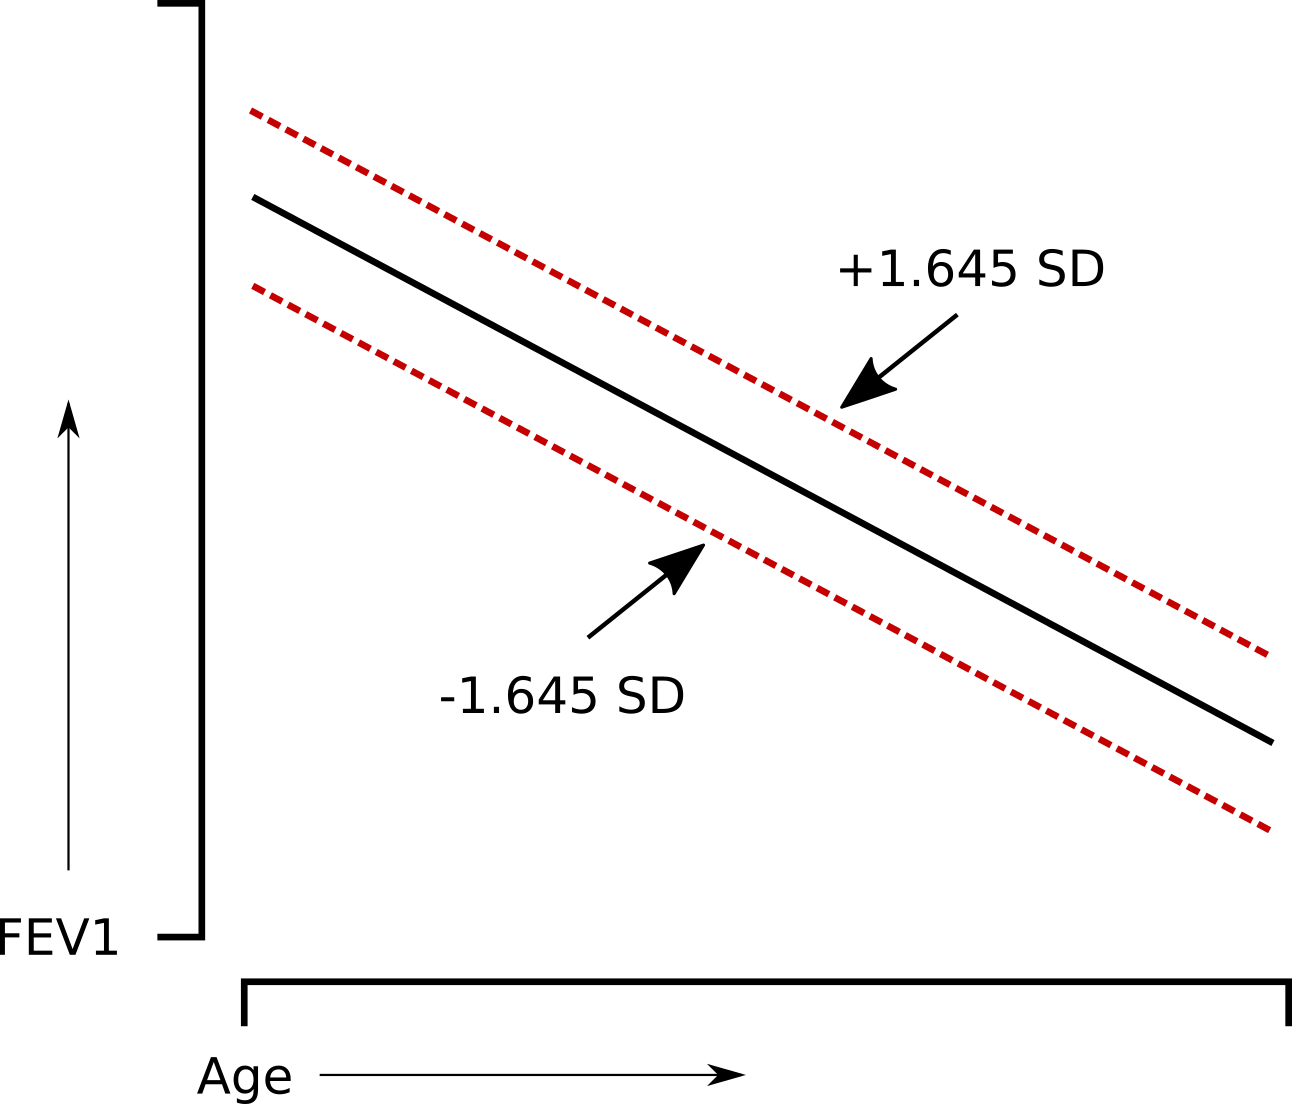
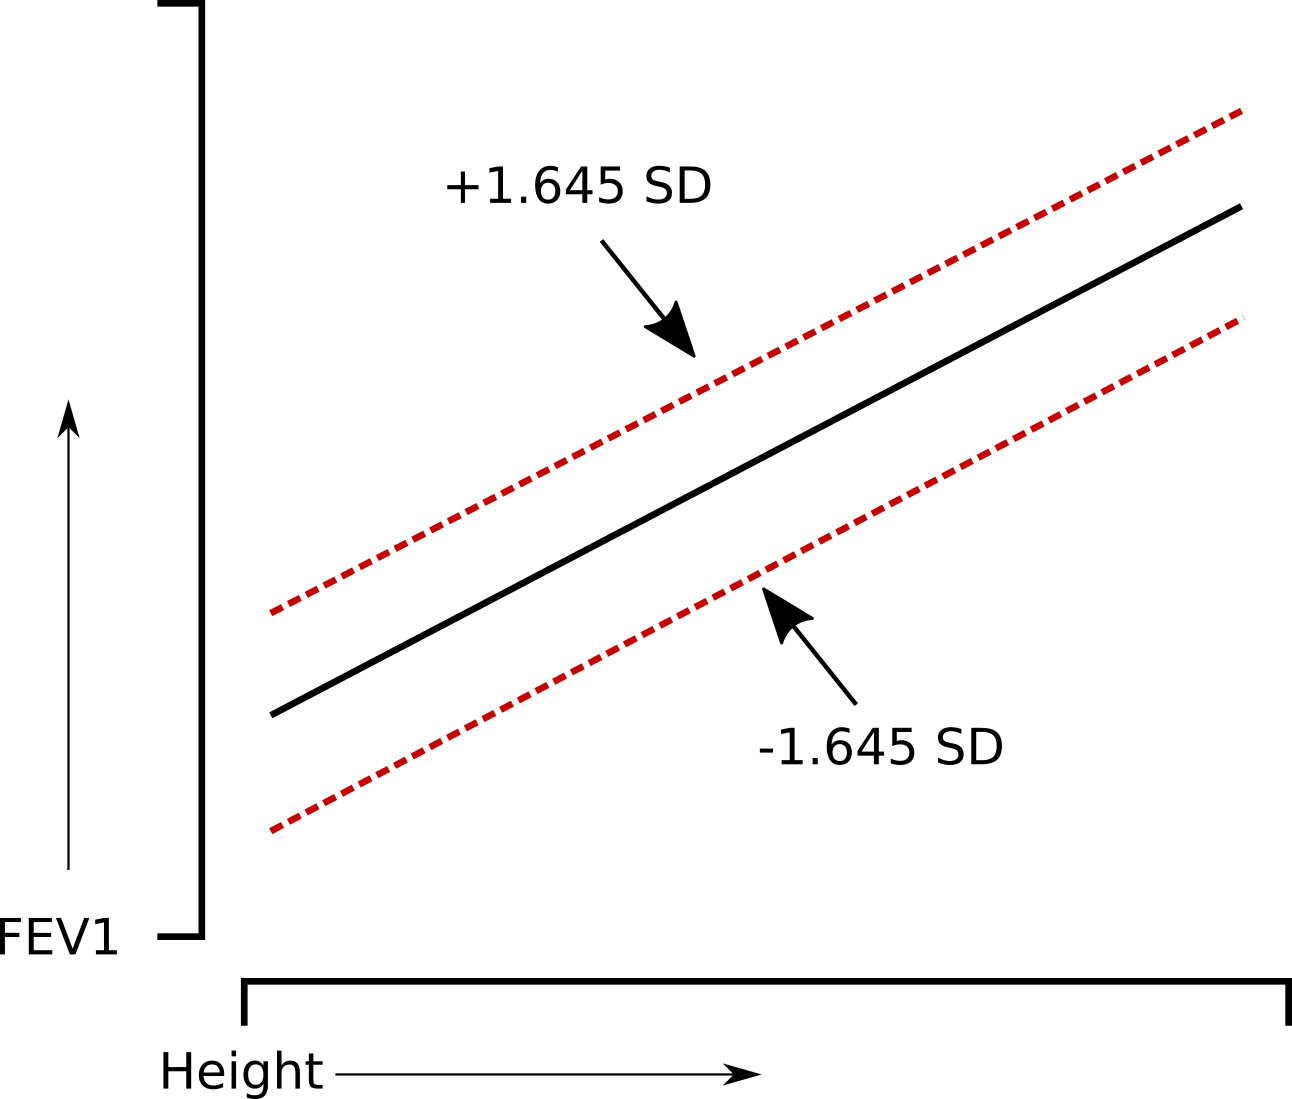
The question is whether or not this is a problem for those individuals at the extremes of height or age. The answer depends on whether or not the results for the group are homoscedastic, that is whether or not the variance of the results show a homogeneous amount of variability across the range of results. Many of the more recent studies indicate that this is indeed the case, but I’m not sure that this type of distribution applies to all of the variables. For example, it’s relatively easy to believe that a homoscedastic distribution applies when the variable is age. But how about height?
FVC and FEV1 change by at least a factor of two over the normal range of heights. If FEV1, for example was homoscedastically distributed by height:
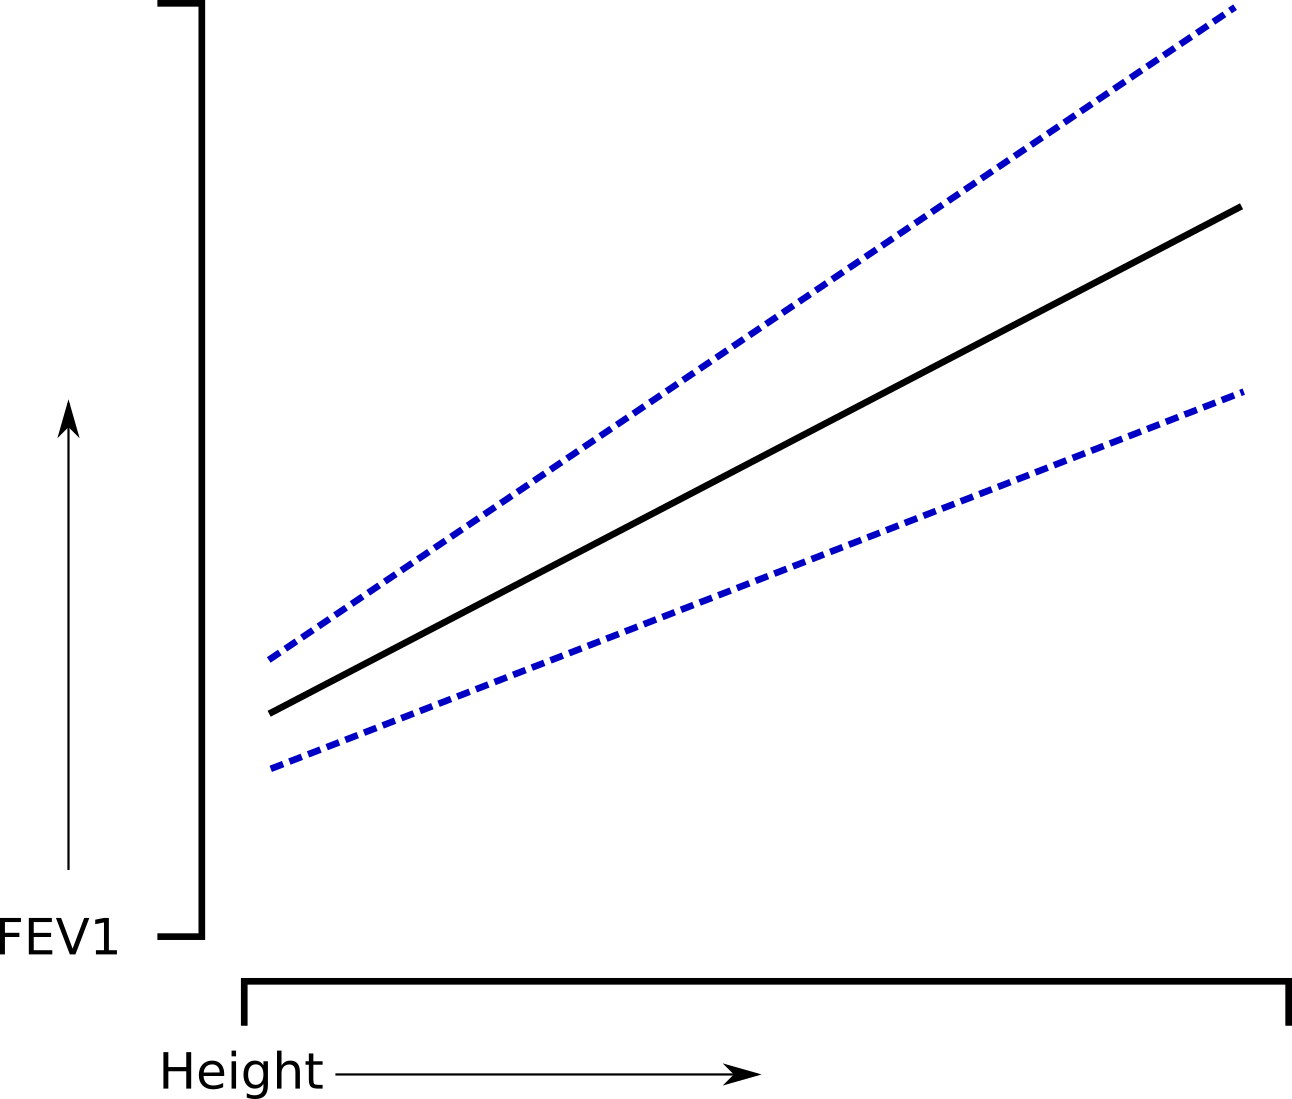
that would also imply that the range of normal values for a short individual with a small lung is proportionally larger than it is for a tall individual with a large lung. This just doesn’t seem correct and it is more likely that the range of normal values is relatively proportional to size of the lung.
This type of problem is offset to a large extent by more complex statistical analysis. In particular the Lambda-Mu-Sigma method (LMS) which uses the “skewness” of the results (Lambda), the non-uniform distribution of the results (Mu) and the coefficient of variation for the results (Sigma) to produce Z scores which have been shown to be a better fit of clinical abnormalities than Z scores derived from simple multiple regression.
Z-scores aren’t that hard. Use of the Z score can be made easier when the results are presented in an appropriately helpful manner. For example a graph like this:
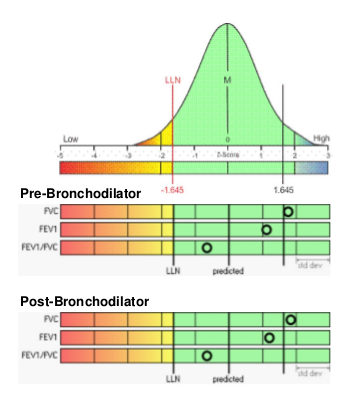
Graphic courtesy of Morgan Scientific
can make it immediately clear what probability a given result has for being normal or abnormal.
In the “bad old days” normal results were defined by being 80% of predicted or above. This most likely came about because 80%-60%-40% was an easy rule to remember for classifying results but was also completely arbitrary. The selection of the bottom 5% of the population as the LLN is certainly less arbitrary since it is grounded in biological research. The common practice however, is just to report the LLN next to the observed result and leave it up to the reviewer to eyeball the difference between the two. Remembering that a Z score of -1.645 is the LLN is not quite as easy to remember as 80% but including the Z score for a result has the ability to give a reviewer a sense of how “normal” or “abnormal” it actually is.
For the time being the percent predicted will continue to be reported and this is so that severity can be assigned when results are below the LLN. At least one study has indicated that Z scores of -2, -2.5, -3 and -4 can be used for the same purpose but this has not yet become standard practice.
One limitation of both Z scores and the LLN is that they are linked to a specific single population study. For this reason their actual value will depend on how a study population is subdivided, the quality of its statistical analysis and on the quality of the study population itself. But the same limitations also apply when using criteria like 80%-60%-40% to assess results.
In general I think that it’s part of human nature to prefer simple answers and to only want to know whether a result is normal or abnormal but that requires thinking only in terms of black and white. Like it or not, the range between normal and abnormal involves shades of gray. The Z score makes these shades of gray clearer.
References:
Drummond MB, Hansel NN, Connett JE, Scanlon PD, Tashkin DP, Wise RA. Spirometric predictors of lung function decline and mortality in early chronic obstructive pulmonary disease. Amer J Respir Crit Care Med 2012; 185(12): 1301-1306.
Fragoso CAV, Gill TM, McAvay G, Van Ness PH, Yaggi HK, Concato J. Use of Lambda-Mu-Sigma-Derived Z Score for evaluating respiratory impairment in middle-aged persons. Resp Care 2011; 56(11): 1771-1777.
Stanojevic S, Wade A, Stocks J, Hankinson J, Coates AL, Pan H, Rosenthal M, Corey M, Lebecque, Cole TJ. Reference rages for spirometry across all ages. Amer J Respir Crit Care Med 2008; 177(3): 253-260.
Quanjer PH, Pretto JJ, Brazzale DJ, Boros PW. Grading the severity of airways obstruction: new wine in old bottles. Eur Respir J 2014; 43(2): 505-512.

PFT Blog by Richard Johnston is licensed under a Creative Commons Attribution-NonCommercial 4.0 International License
Excellent and timely post Sir!! I/we use MGC Diagnostics BreezeSuite software which does not allow for calculating Z-Scores only LLN & ULN. It probably will carry little weight, but I plan to encourage MGC to include Z-Score calculation capability in their pending software upgrade as it would appear this is the most accurate way to interpret normal or abnormal results.
Thank you very much, I always looking forward to your Sunday morning emails!
Jim Norton,
Richmond, VA