When it comes to spirometry, it’s really all about FEV1. FVC and the FEV1/FVC ratio are also important of course, but because FVC is more likely to be underestimated than FEV1 they are less reliable.
Changes in FEV1 are critical in monitoring airway disease. The recent ATS guidelines on Occupational Spirometry indicate that a 15% decrease (adjusted for changes in age) is significant and cause for concern. For diagnosing airways disease however, it is important to know what a normal FEV1 is.
I have been able to find twenty-four different reference equations for FEV1. That’s good in one sense but that quantity also makes it that much more difficult to determine which reference equations should be used. When I graph results it often becomes more apparent what the equations are trying to tell us but in this case I came away a bit more confused instead.
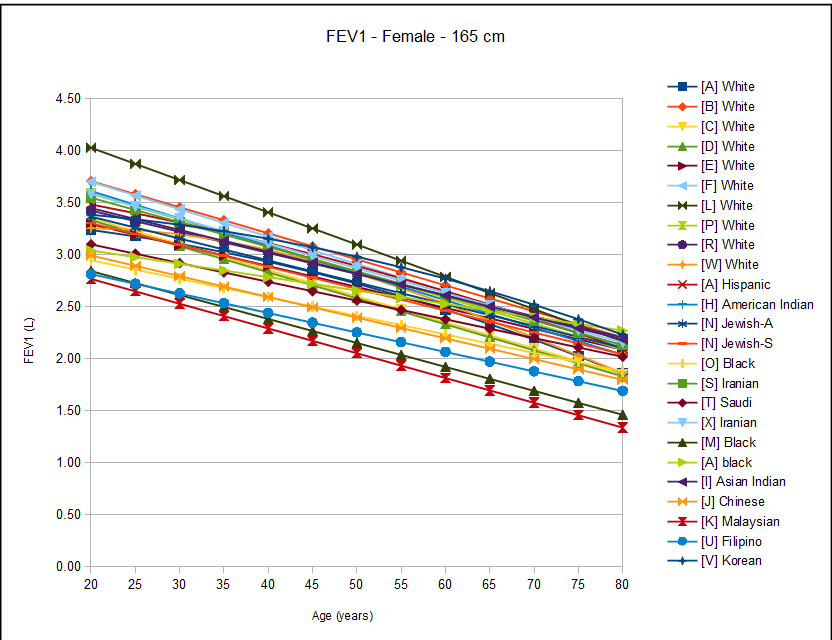
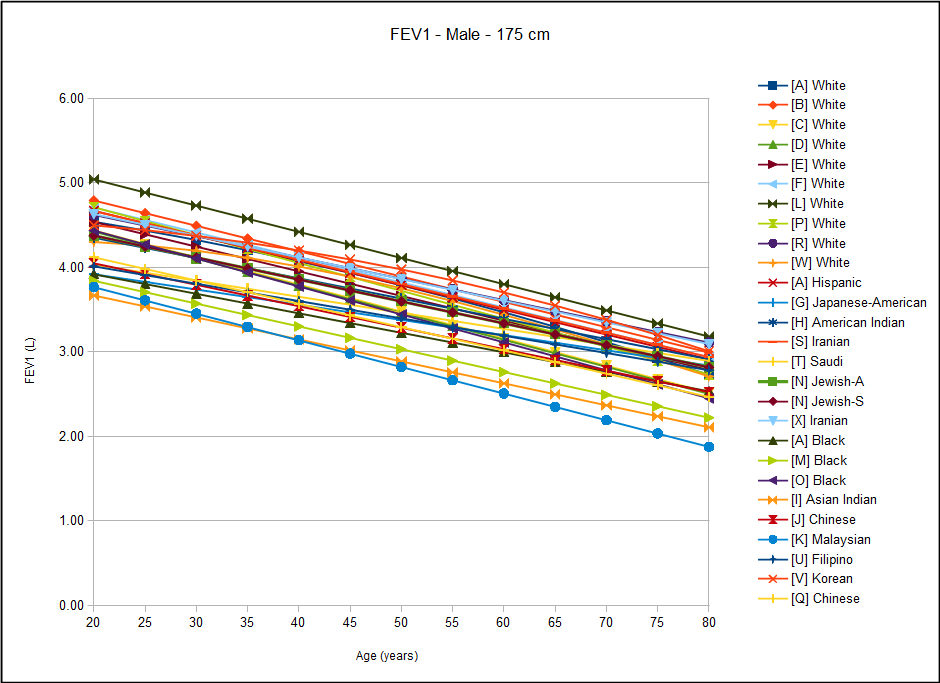
After gender, height and age, ethnicity is considered to be a critical factor in determining normal values. For this reason, I re-graphed the FEV1 results and (somewhat arbitrarily) clustered the different ethnicities based (mostly) on their geographic location.
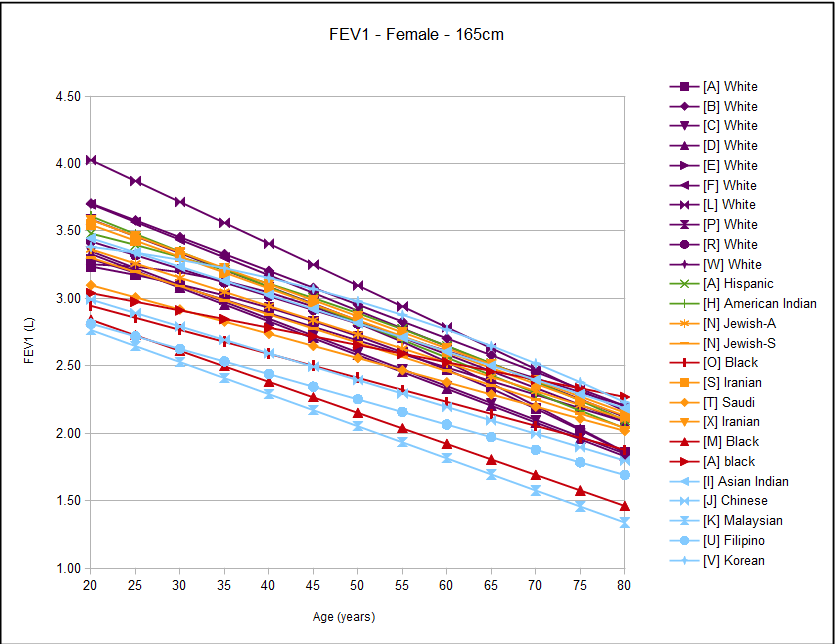
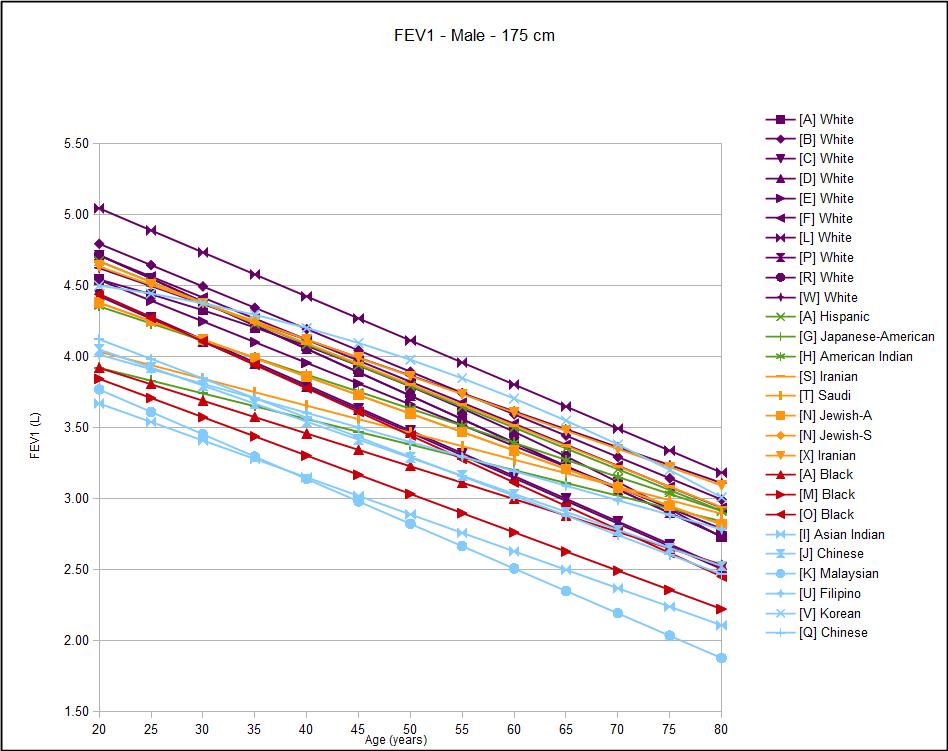
What I saw was a great deal of overlap between ethnicities and a great deal of variance within ethnicities.
Ethnicity may be important but the more closely you look at ethnicity the less apparent it becomes as to what it actually means. The primary problem with ethnicity and reference equations revolves around the use of standing height as a metric for lung volume.
Ideally, we would like to know what an individual’s lung function “should” be if they were in perfect health. An individual’s “ideal” FEV1 will depend on lung volume and airway caliber, neither of which can be determined with any precision from simple external measurements. There are a number of proportionalities however, between different parts of the human anatomy that are fairly constant across a broad range of human heights and the volume of the thorax is one of these. This relationship was first noted by John Hutchinson over 150 years ago and has been used ever since. The proportionality is not exact, of course, since there is approximately a 30% range in FEV1 across all ethnicities (at least based on these reference equations there is).
Given the way humans have settled over the earth throughout history, it is not surprising that there would be clustering in genes, diet and environment that would cause local populations to have similar relationships between height and FEV1 (and the other lung function values). Historically this has been taken by researchers as a genetic issue, most particularly the distinction between whites and blacks. I (and many others) strongly suspect that diet and environment have as much, if not much greater, effect. Since not only our genes but both diet and environment play a large role in the development and maturity of the human body as well I guess we should be amazed that the range is only 30%.
But 30% is a pretty broad range and can make the difference between calling an FEV1 either normal or abnormal for a very large number of people. Although we categorize these differences under the heading of “ethnicity” what this really means is that there are factors other than height that predict lung volume and airway caliber and we don’t know what they are.
Every lab should choose reference equations that are appropriate to the population they serve but there are no real guidelines on determining this. Probably all too often labs leave their test equipment software set to the manufacturer’s default settings, partly, perhaps in the belief that the equipment manufacturer knows better than they do what reference equations should be used.
There are several factors that I think would help a lab and interpreting physician select reference equations. Although ethnicity should be a consideration it is a slippery concept and frequently lab populations don’t fit neatly into any specific group. A far more important factor should be, I think, the size of the study group. Larger is better and this is because small groups are more prone to selection effects. Next would be good representation of all age groups, particularly the young and the elderly.
The last factor is good statistics. This is not an area that I am particularly qualified to judge, but I’ve seen that the studies with the largest populations and most sophisticated statistical analysis (ie., NHANESIII) show that the decline in FEV1 (and other lung function values) is not linear but accelerates with age. Given the aging of the populations we serve I think this is a critical factor and that reference equations that don’t show this may be causing a mis-interpretation of test results in the elderly.
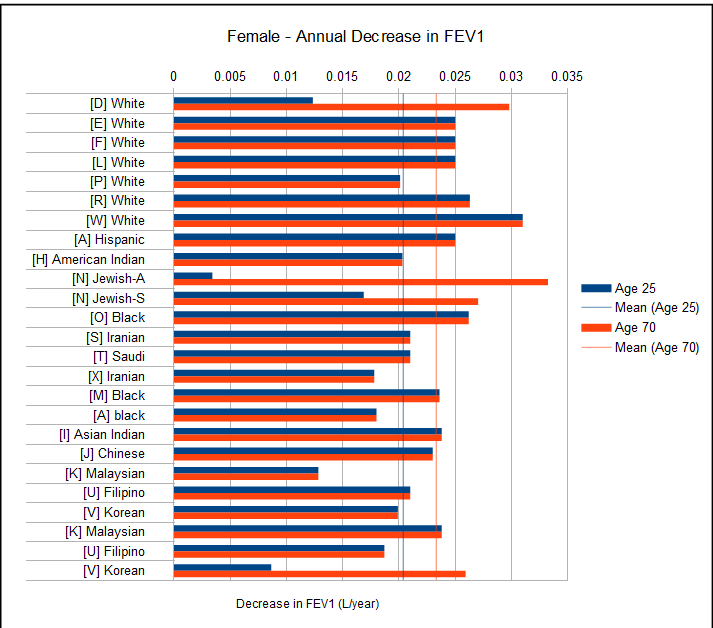
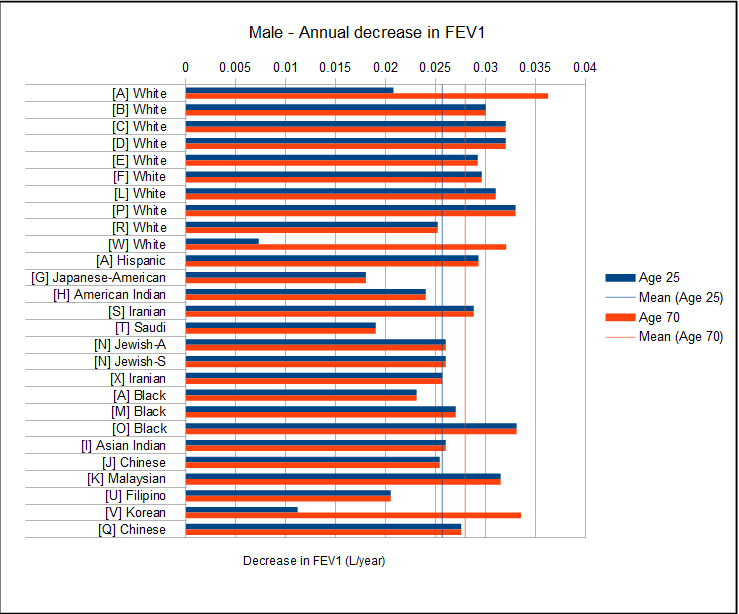
The apparent rates of decline in FEV1 should be taken with a grain of salt. These are from static population studies and not longitudinal studies. Having said that the ATS Statement on Occupational Spirometry indicates that a normal decline for non-smoking adults is around 29 ml/year and although that value is closely approximated by most of these reference equations, I don’t think that this should be a primary factor in selecting an FEV1 reference equation.
A final thought is that many of the older studies were performed using equipment that may be significantly different from that in use today. Testing standards have also been refined as well and these two factors may account for some of the differences from more recent studies.
The simple answer to the question I posed at the beginning of this blog is that ethnicity does matters, and it matters a lot, but the real and more complex answer is that it is not at all clear what ethnicity is even when we think we know what it is. The Global Lung Initiative released their preliminary spirometry reference equations based on results from PFT Labs around the world a year or so ago but has indicated they await further data in order to continue to refine them. Despite the fact their reference equations come from an exceptionally large and diverse population it is interesting to note that they have already been criticized for not meeting the needs of a local population.
I think that continuing to focus on ethnicity is not giving us the right answers. We need to start looking for metrics that can be used in place of, or along with, height that don’t depend on ethnicity. I will admit that I don’t have any clear notion what we should be looking for. Sitting height has been used several times but has not been shown to be a significant improvement over standing height. Attempting to measure chest breadth and depth is frustrated by the tissue (muscle and fat) that overlays the ribcage and also doesn’t say anything about the anatomical position of the diaphragm. Perhaps some combination of standing height, sitting height, chest measurements and BMI would be better than standing height alone. This would place a greater burden on PFT labs to make these measurements, but I think the improvement in precision would be worth it.
FEV1 Study Populations:
| Reference | Ethnicity: | #Female: | Female Ages: | #Male: | Male Ages: |
| [A] | White | 927 | 21-80 | 476 | 21-80 |
| Black | 772 | 21-80 | 422 | 21-80 | |
| Hispanic | 872 | 21-80 | 506 | 21-80 | |
| [B] | White | 327 | 20-79 | 300 | 20-79 |
| [C] | White | 471 | 20-84 | 517 | 20-84 |
| [D] | White | 97 | Not stated | 102 | Not stated |
| [E] | White | 176 | 20-69 | 86 | 25-70 |
| [F] | White | 1129 | 27-82 | 1106 | 27-82 |
| [G] | Japanese-American | 0 | 6349 | 45-68 | |
| [H] | American Indian | 253 | 45-74 | 190 | 45-74 |
| [I] | Asian Indian | 137 | 20-80 | 226 | 16-80 |
| [J] | Chinese | 595 | 18-80 | 494 | 18-80 |
| [K] | Malaysian | 614 | 20-69 | 1385 | 20-69 |
| [L] | White | 102 | 18-70 | 110 | 18-70 |
| [M] | Black | 205 | 18-90 | 206 | 18-85 |
| [N] | Jewish-Ashkenazi | 663 | 20-74 | 1154 | 21-79 |
| Jewish-Sephardic | 547 | 20-69 | 786 | 21-84 | |
| [O] | Black | 117 | 18-47 | 143 | 18-47 |
| [P] | White | 96 | 18 to >70 | 83 | 18 to >70 |
| [Q] | Chinese | 0 | 440 | 18-80 | |
| [R] | White | 270 | 25 to >75 | 373 | 20 to >75 |
| [S] | Iranian | 255 | 17-82 | 295 | 17-82 |
| [T] | Saudi | 292 | 18-65 | 175 | 18-65 |
| [U] | Filipino | 153 | 16-68 | 130 | 17-78 |
| [V] | Korean | 694 | 20+ | 926 | 20+ |
| [W] | White | 7009 | 18-80 | 4565 | 18-80 |
| [X] | Iranian | 1110 | 21-80 | 1302 | 21-80 |
Female FEV1 Reference Equations:
| [A] White | 0.4333-(0.00361*age)-(0.000194*age^2)+(0.00010846*ht^2) |
| [B] White | -1.901+(0.037*ht)-(0.025*age) |
| [C] White | (0.089*(ht/2.54)-(0.025*Age)-1.932) |
| [D] White | (0.085*(ht/2.54))-(0.025*age)-1.692 |
| [E] White | -1.405+(0.0309*ht)-(0.0201*age) |
| [F] White | -1.747-(0.0263*age)+(3.619*(ht/100)) |
| [L] White | -2.73-(0.031*age)+(4.47*(ht/100)) |
| [P] White | (3.321*(ht/100))-(0.025*age)-1.394 |
| [R] White | (0.0314*ht)-(0.0203*age)-1.353 |
| [W] White | EXP(-8.397+(1.865*LN(ht))+(0.0057*age)-(0.00015*age^2)) |
| [A] Hispanic | 0.4529-(0.01178*age)-(0.000113*age^2)+(0.00012154*ht^2) |
| [H] American Indian | (0.0358*ht)-(0.0262*age)-1.774 |
| [N] Jewish-A | -1.574-(0.021*age)+(3.247*(ht/100)) |
| [N] Jewish-S | -1.636-(0.021*age)+(3.247*(ht/100)) |
| [O] Black | -1.6158-(0.0178*age)+(0.0298*ht) |
| [S] Iranian | (0.039489*ht)-(0.023593*age)-2.498 |
| [T] Saudi | (0.036*ht)-(0.018*age)-2.482 |
| [X] Iranian | (0.03715*ht)-(0.0238*age)-2.072 |
| [M] Black | -1.398-(0.023*age)+(2.848*(ht/100)) |
| [A] black | 0.3433-(0.01283*age)+(0.00010846*ht^2) |
| [I] Asian Indian | 0.401+(0.021*ht)-(0.021*age) |
| [J] Chinese | -1.272-(0.0199*age)+(0.02825*ht) |
| [K] Malaysian | (0.0294*ht)-(0.0238*age)-1.609 |
| [U] Filipino | -1.0375+(0.0256*ht)-(0.0187*age) |
| [V] Korean | (0.03558*ht)-(0.000192*age^2)-2.4114 |
Male FEV1 Reference Equations:
| [A] White | 0.5536-(0.01303*age)-(0.000172*age^2)+(0.00014098*ht^2) |
| [B] White | -2.832+(0.047*ht)-(0.03*age) |
| [C] White | (0.092*(ht/2.54))-(0.032*age)-1.26 |
| [D] White | (0.093*(ht/2.54))-(0.032*age)-1.343 |
| [E] White | -6.5147+(0.0665*ht)-(0.0292*age) |
| [F] White | -4.261-(0.0296*age)+(5.465*(ht/100)) |
| [L] White | -2.16-(0.031*age)+(4.47*(ht/100)) |
| [P] White | (3.961*(ht/100))-(0.033*age)-1.558 |
| [R] White | (0.0338*ht)-(0.0252*age)-0.789 |
| [W] White | EXP(-8.957+2.014*LN(ht)+(0.00281*age)-(0.000105*age^2)) |
| [A] Hispanic | 0.6306-(0.02928*age)+(0.00015104*ht^2) |
| [G] Japanese-American | -1.845-(0.018*age)+(0.035*ht) |
| [H] American Indian | (0.0599*ht)-(0.024*age)-5.65 |
| [S] Iranian | (0.043822*ht)-(0.028801*age)-2.425 |
| [T] Saudi | (0.036*ht)-(0.019*age)-1.886 |
| [N] Jewish-A | -3.302-(0.026*age)+(4.686*(ht/100)) |
| [N] Jewish-S | -3.302-(0.026*age)+(4.686*(ht/100)) |
| [X] Iranian | (0.045302*ht)-(0.02566*age)-2.78204 |
| [A] Black | 0.3411-(0.02309*age)+(0.00013194*ht^2) |
| [M] Black | -1.933-(0.027*age)+(3.609*(ht/100)) |
| [O] Black | -3.6679-(0.0331*age)+(0.0501*ht) |
| [I] Asian Indian | -1.936+(0.035*ht)-(0.026*age) |
| [J] Chinese | -2.404-(0.0254*age)+(0.03978*ht) |
| [K] Malaysian | (0.0353*ht)-(0.0315*age)-1.78 |
| [U] Filipino | -3.2068+(0.0436*ht)-(0.0205*age) |
| [V] Korean | (0.04578*ht)-(0.0002484*age^2)-3.4132 |
| [Q] Chinese | -1.86083-(0.02755*age)+(0.03733*ht) |
References:
| [A] | Hankinson JL, Odencrantz JR, Fedan, KB. Spirometric reference values from a sample of the general U.S. Population. Amer J Resp Crit Care 1999; 159: 179-187 |
| [B] | Gutierrez C, et al. Reference values of pulmonary function tests for Canadian caucasians. Can Respir J 2004; 6: 414-424. |
| [C] | Morris JF, Koski A, Johnson LC. Spirometric standards for healthy nonsmoking adults. Am Rev Resp Dis 1971; 103: 57-67. |
| [D] | Morris JF, Koski A, Temple WP, Claremont A, Thomas DR. Fifteen-year interval spirometric evaluation of the Oregon Predictive equations. Chest 1988; 93: 123-27 |
| [E] | Knudson RJ, Lebowitz MD, Holberg CJ, Burrows B. Changes in the normal maximal expiratory flow volume curve with growth and aging. Am Rev Resp Dis 1983; 127: 725-734 |
| [F] | Johannessen A, Lehmann S, Omenaas ER, Side GE, Bakke PS, Gulsvik A. Post-bronchodilator spirometry reference values in Adults and implications for disease mangement. Amer J Resp Crit Care Med 2006; 173(12): 1316-1325 |
| [G] | Marcus EB, MacLean CJ, Curb JD, Johnson LR, Vollmer WM, Buist AS. Reference Values for FEV1 in Japanese-American Men from 45 to 68 years of age. Am Rev Respir Dis 1988; 138:1393-1397 |
| [H] | Marion MS, Leonardson GR, Rhoades ER, Welty TK, Enright PL. Spirometry reference values for American Indian adults. Chest 2001; 120: 489-495 |
| [I] | Fulambarker A, Copur AS, Javen A, Jere S, Cohen ME. Reference values for pulmonary function in Asian Indians living in the United States. Chest 2004; 126: 1225-1233 |
| [J] | Ip MS, Ko FW, Lau AC, Yu W, Tang K, Choo K, MM Chan-Yeung. Updated spirometric reference values for Adult Chinese in Hong Kong and implications on clinical utilization. Chest 2006; 129: 384-392. |
| [K] | Singh R, Singh HJ, Sirisinghe RG. Spirometric studies in Malayasian between 13 and 69 years of age. Med J Malaysia 1993; 48: 175-184 |
| [L] | Marsh S, Aldington S, Williams M, Weatherall M, Shirtcliffe P, McNaughton A, Pritchard A, Beaseley R. Complete reference ranges for pulmonary function tests from a single New Zealand population. New Zealand Med J 2006; 119: N1244. |
| [M] | Perfura-Yone EW, Kanko-Nguekam NF, Kengne AP, Balkissou AD, Noseda A, Kuaban C. Spirometric Reference Equations for semi-urban and urban Bantu Cameroonians. Open J Resp Dis 2013; 3: 164-174. |
| [N] | Steinvil A, Fireman E, Wolach O, Rebhun U, Cohen M, Shapira I, Berliner S, Rogowski O. The effect of ethnic origin on pumonary prediction equations in a Jewish immigrant population. Respiratory Medicine 2008; 102: 919-926. |
| [O] | Mengesha YA, Mekonnen Y. Spirometric lung function tests in normal non-smoking Ethiopian men and women. Thorax 1985; 465-468. |
| [P] | Roberts CM, MacRae KD, Winning AJ, Adams L, Seed WA. Reference values and prediction equations for normal lung function in a non-smoking white urban population. Thorax 1991; 46: 643-650. |
| [Q] | Lam DCL, Fong DYT, Yu WC, Ko FWS, Lau ACW, Chan JWM, Choo KL, Mok TYW, Tam CY, Ip MSM, Chan-Yeung MMW. FEV3, FEV6 and their derivatives for detecting airflow obstruction in adult Chinese. Int J Tuberc Lung Dis 2012; 16(5): 681-686. |
| [R] | Pereira CADC, Sato T, Rodrigues SC. New Reference Values for forced spirometry in white adults in Brazil. J Bras Pneumol 2007; 33: 397-406. |
| [S] | Razi E, Moosavi GHA, Akbari H. Spirometric standards for healthy Iranians dwelling in the centre of Iran. Tanoffos 2005; 4(15): 19-26. |
| [T] | Al Ghobain MO, Ahamad EH, Alorainy HS, Hazmi MA, Al Moamary MS, Al-Hajjaj MS, Idress M, Al-Jahdali H, Zeitouni M. Spirometric reference standards for healthy nonsmoking Saudi adults. Clinical Respir J 2014; 8: 72-78. |
| [U] | Roa CC, Zaldivar CA, Salonga RC, Bobadilla J, Lansang MA, Reodica R, Balgos A, Blanco J, Tanchuco JQ. Normal standards for ventilatory function in adult Filipinos. Phillipine J Internal Med, 2013; 51(1): 1-6. |
| [V] | Oh YM, Hong SB, Shim TS, Lim CM, Koh Y, Kim WS, Kim DS, Kim WD, Kim YS, Lee SD. Effect of a new spirometric reference equation on the interpretation of spirometric patterns and disease severity. Tuber Respir Dis 2006; 60: 215-220. |
| [W] | Kuster SP, Kuster D, Schindler C, Rochat MK, Braun J, Held L, Brandli O. Reference equations for lung function screening of healthy never-smoking adults aged 18-80 years. Eur Respir J 2008; 31: 860-868. |
| [X] | Golshan M, Nematbakhsh M, Amra B, Crapo RO. Spirometric reference values for a large Middle Eastern population. Eur Respir J 2003; 22: 529-534. |
Ben Saad H, El Attar MN, Hadj Mabrouk K, Ben Abdelaziz A, Abdelghani A, Bousarssar M, Limam K, Maatoug C, Bouslah H, Charrada A, Rouatbi S.The recent multi-ethnic global lung initiative 2012 (GLI2012) reference values don’t reflect contemporary adult’s North African spirometry. Respiratory Medicine 2013; 107: 2000-2008.
Redlich CA, Tarlo SM, Hankinson JL, Townsend MC, Eschenbacher WL, Von Essen SG, Sigsgaard T, Weissman DN. Official American Thoracic Society Technical Stanards: Spirometry in occupational setting. Amer J Respir Crit Care Med 2014; 189(8): 984-994.

PFT Blog by Richard Johnston is licensed under a Creative Commons Attribution-NonCommercial 4.0 International License.