The lungs are the gas exchange organ of the body. The mechanical aspects of the lung, which do of course have a bearing on gas exchange, can be assessed by spirometry and lung volume tests but for a complete assessment of an individual’s lung function a diffusing capacity test (DLCO) must be performed as well. The actual gas exchange rate at any moment can be highly variable and depends on a number of factors such as cardiac output, pulmonary capillary blood volume and ventilation-perfusion matching that are difficult to measure. For this reason the diffusing capacity test, more so perhaps than any other pulmonary function test, must be performed in a highly standardized way in order to produce results that can be meaningfully trended over time and meaningfully compared to other individuals.
Accurate diffusing capacity results therefore depend on attention to details such as inspiratory time, inspiratory capacity, breath-holding time, washout volume and alveolar sample size. Even when these values are essentially identical results can still vary dramatically from test to test. For this reason my PFT lab’s policy is to perform a minimum of two DLCO tests and if the results aren’t reproducible then a third test and possibly a fourth test. Whenever possible the closest (not the highest) results from two good quality tests are averaged and reported. We think that this approach gives is the best way to get accurate and reproducible DLCO test results from our patients.
This may give my lab DLCO results that are adequate for trending but how do we know when they are normal? Like everybody else we have to rely on a reference equation generated from a study of presumably normal individuals. Selecting the proper reference equation continues to be an ongoing problem. I have been able to find fourteen different DLCO reference equations that appear to be in more-or-less common use. Even after comparing them however, I am not sure the selection process is any clearer or easier.

The ATS and ERS do not specifically recommend any particular reference equation. They have recommended using reference equations that have a lower limit of normal (LLN) but at this time I do not believe that any study meets this requirement. There are DLCO studies that publish a LLN but it is a single value that is applied to all ages and heights and for this reason I do not think that this is particularly useful.
I believes the ATS-ERS recognizes the limitations of LLN in reference equations because the ATS-ERS statement on PFT interpretation advocates the use of a DLCO percent predicted of 80% as the normal cutoff. It also indicates that 79% to 60% of predicted is a mild reduction, 59% to 40% is a moderate reduction and that values less than 40 of predicted are severely reduced.
The majority of reference equations I was able to find are for Caucasian populations (9), with the next largest group being Chinese (2), followed by Hispanic (1), Indian (1) and Brazilian (1). I am concerned that I was not able to find any reference equations for Blacks, which is a glaring omission. I was able to find two studies that compare results from a Black study population to Caucasian values but neither study generated reference equations for Blacks. The Chinese and Indian reference equations produce the lowest values which is consistent with the spirometry and lung volume reference values for the same populations. The the reference values for Hispanic and Brazilian populations were not significantly different from those for Caucasians.
Other than ethnicity, there are differences in methodology that can affect a reference equation. One of these is how breath-holding time (BHT) is measured. Calculated DLCO is inversely related to the measured BHT. This means that for the same DLCO test effort, the shortest measured BHT produces the highest calculared DLCO. The current ATS-ERS recommendation is to use the Jones-Meade method because it is least affected by airway obstruction. The Ogilvie method produces similar results to Jones-Meade in normal patients, but tends to underestimate BHT when airway obstruction is present. The ESP method always produces the smallest BHT which leads to the largest calculated DLCO results.
Another reason to select one reference equation over another is that the FIO2 used to measure DLCO will also affect results. Because carbon monoxide competes with oxygen for uptake by hemoglobin, lower FIO2’s lead to higher measured DLCO’s and vice versa. European Pulmonary Function labs tend to use an FIO2 that matches that of expired alveolar air (~18%) whereas American labs use an FIO2 that matches room air (~21%).
There are two reference equations that seem to be in error. I suspect there is a transcription error in the female Indian reference equation [M] since the values it produces do not match those discussed in the text of the article they came from. One of the Chinese female reference equations [E] may be accurate for the average height range of the study’s population, but when at higher heights, even those at the upper limit of the published range (174 cm) the results show a negative slope for age (i.e. results get higher with increasing age). Although this may be due to a transcription error it may instead be due to the unusual form of the equation since it includes a weighting factor for [height x age] as well as for height and age.
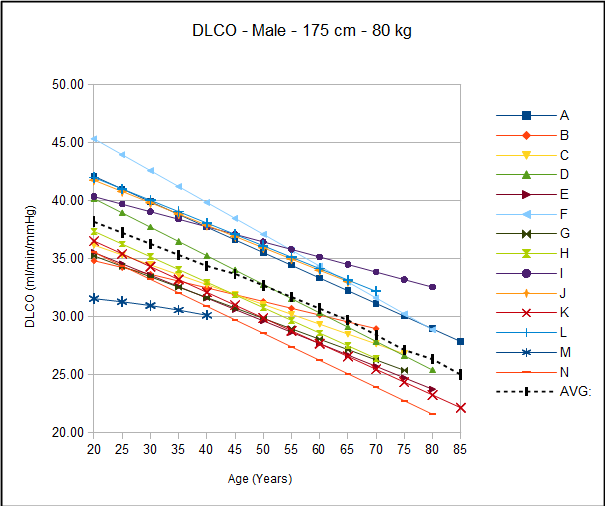
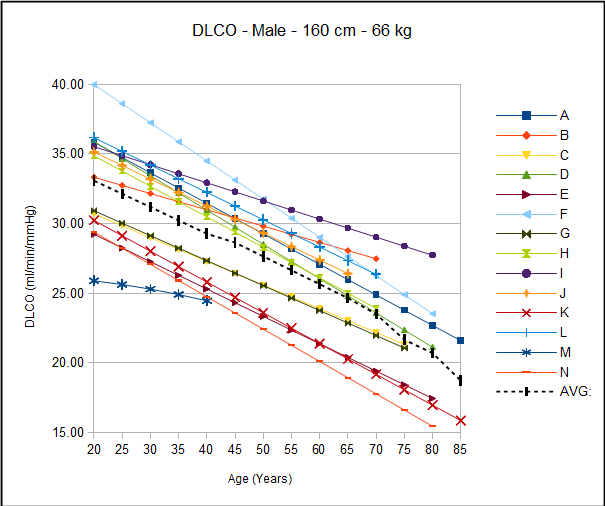
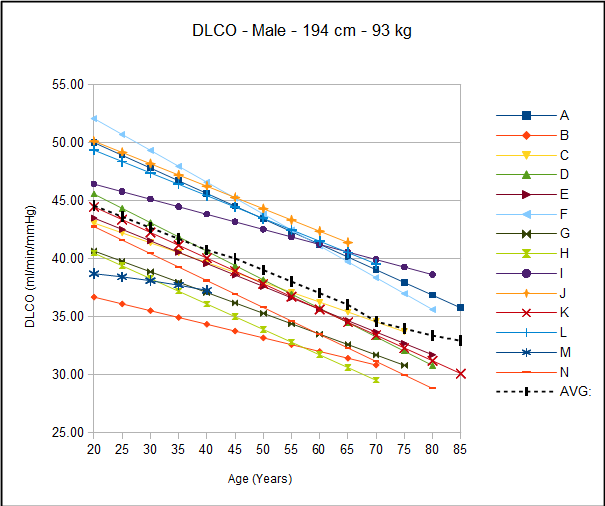
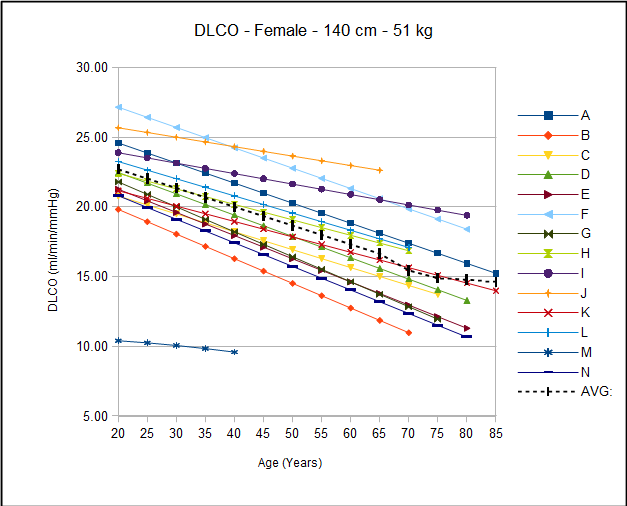
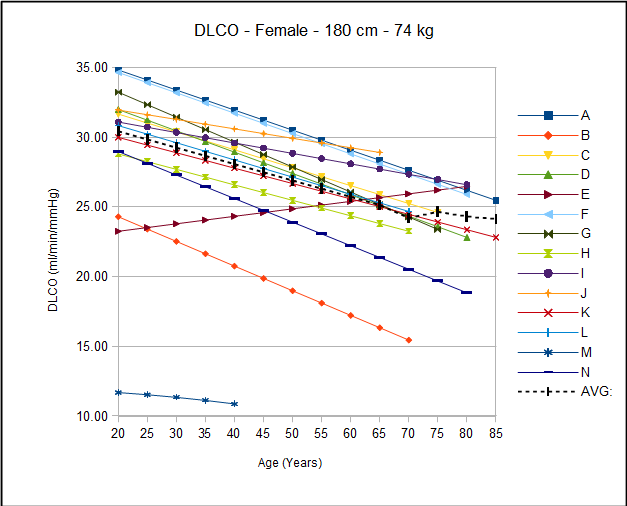
The differences between reference equation values can be dramatic and this has implications about whether an individual’s measured DLCO will be considered normal or not. For Caucasian males of average height and weight (175 cm, 80 kg) the range of predicted normal values at age 50 is 29.85 to 36.09 (80% cutoff 23.88 to 28.87) which is 19% of the average value. For Caucasian females of average height and weight (160 cm, 60 kg) the range of predicted normal values at age 50 is 17.44 to 27.47 (80% cutoff 13.95 to 21.98) which is 42% of the average value.
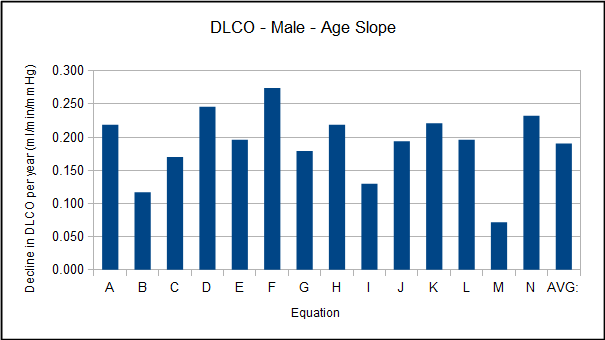
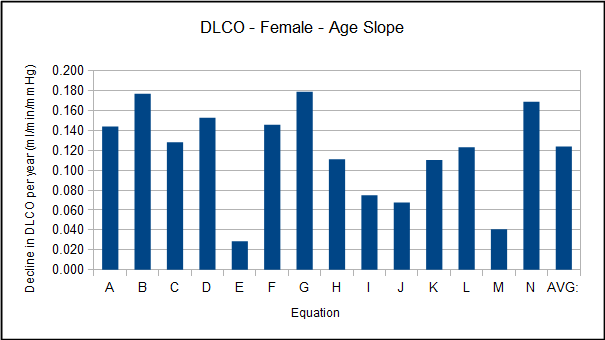
Height and age are the primary factors for all DLCO reference equations. The apparent decline in DLCO with age (which is based solely on the equations and not on any longitudinal studies and is independent of height) ranges from 0.117 to 0.246 ml/min/mmHg per year for Caucasian males and 0.068 to 0.179 ml/min/mmHg per year for Caucasian females.
The effect of height is a bit more difficult to assess because it depends on what age you are comparing them at. Using the same height limits I’ve used in the past (160 to 194 cm for males and 140 to 180 cm for females) the differences graph like this:
 So how do you decide which reference equations to use? I wish I could be definitive about this issue but the fact is that the selection of reference equations for DLCO remains a subjective process. The first place to start should be (with limitations) the ethnicity of the population your lab services. The problem with this is first whether there is a reference equation that meets this criteria and second is in defining ethnicity. Even for Caucasians, a supposedly well-defined group, there is a very broad range of predicted normal values and I suspect that with sufficient additional studies this would also prove true for other, currently underrepresented, ethnicities.
Note: This is one reason why some researchers (not reported here) have advocated the use of the VA measured during the DLCO test as a factor in reference equations. VA, however, is usually underestimated (less than measured TLC) when airway obstruction is present, and I think this fact alone places severe limitations on the validity of VA as a factor in reference equations.
Factors like the choice of BHT methodology and the FIO2 used should also be a consideration. Studies that don’t don’t match a lab’s procedure or equipment requirements should probably not be selected.
Next, simply because a given reference equation produces results that are near the average value for all equations does not make it more accurate if for no other reason than the average value is affected by the equations chosen to calculate it. Having said that, there are worse reasons to select a reference equation and I think that you need some particularly good justification to use reference equations that are at the top or the bottom the range for age or height. When I look at graphed results, for Caucasian males equation D seems to be nearest the median for all of the heights and age slopes. For Caucasian females, equation K seems to be closest to the median. That’s a subjective assessment however, and you may well see something different than I do.
When we went through our last hardware and software upgrade I’m afraid that we took the easy course and continued to use the same reference equations the lab has used for the prior 30 years. During the initial software setup we thought we had selected this equation but in fact it defaulted to a different one. We started getting complaints from physicians almost immediately because patients appeared to have large changes in their DLCO, which was true when looking at percent predicted but not true when looking at the actual values. For this reason we switched back to the old reference equation. In retrospect I think this was a mistake because the reference equation we use is somewhat of an outlier, particularly for females but at the time we had limited resources to devote to this issue and there were other problems that looked much bigger.
I would recommend exploring these equations and for this purpose I’d like to share a simple spreadsheet I developed to calculate predicted DLCO based on age, height and weight.
Updated to Adult Reference Equation Explorer:
Adult Reference Equation Explorer – MS Excel Version
Adult Reference Equation Explorer – LibreOffice Version
The Global Lung Function Initiative (GLFI) has indicated that they are starting to develop their own reference equations for DLCO. I welcome this because they have support from researchers around the world and a very sophisticated approach towards statistics. Almost all of the current DLCO reference equations are simple linear regressions. Linearity was shown to be incorrect in spirometry first by NHANESIII and then more definitively by the GLFI. I suspect that DLCO is also less linear than the equations would lead us to suspect particularly for patients that are towards extremes of height and age.
Finally, I am concerned that although the current equipment for DLCO testing meets the letter of the ATS-ERS standards, there are a number of ATS-ERS suggestions for improved testing (PAO2, CO back-pressure) that are not implemented by any manufacturer I am aware of. In addition we have found a number of subtle hardware and software idiosyncrasies in our DLCO testing systems that can have significant effects on results. Although many researchers acknowledge issues like these the fact is that they (and we) are dependent on commercially available testing systems. For these reasons I think it is time the ATS-ERS updated their recommendations on DLCO testing and when they do, they should set the bar higher for equipment manufacturers.
The DLCO test is a critical component of Pulmonary Function testing. Performing it correctly requires close adherence to standards. Even when accurate results are obtained however, they need to be compared to normal values. The choice of which reference equations are used to determine what’s normal has significant implications for the clinical assessment of patients. Unfortunately the selection process remains a conundrum and we need to remember that what’s normal for DLCO is not necessarily clear and that our choices are lines in the sand.
Male DLCO Reference Equation Study Parameters
| Equation | Ethnicity | No. | Ages | Heights | BHT | FIO2 | Hgb Corrected | |
| [A] | Caucasian | 123 | 18-91 | 157-194 | Ogilvie | 25% | Yes | |
| [B] | Caucasian | 98 M+F | n/a | n/a | Ogilvie | n/a | n/a | |
| [C] | Caucasian | 119 | 15-70 | 179.2 +/- 6.6 | Jones-Meade | 20.9-21.9% | Yes | |
| [D] | Caucasian | 300 | 20-79 | n/a | Ogilvie | n/a | No | |
| [E] | Chinese | 259 | 18-80 | 148-182 | Jones-Meade | 21.1% | Yes | |
| [F] | Hispanic | 71 | 25+ | n/a | ESP | 21% | Yes | |
| [G] | Caucasian | 110 | 25-75 | n/a | n/a | n/a | Yes | |
| [H] | Caucasian | 74 | n/a | n/a | Ogilvie | n/a | Yes | |
| [I] | Brazilian | 50 | 20-80 | n/a | n/a | 21% | No | |
| [J] | Caucasian | 243 | 19-64 | 171 +/- 6.7 | ESP | 20% | No | |
| [K] | Caucasian | 83 | 18-86 | 161-196 | n/a | 21% | No | |
| [L] | Caucasian | 194 | 20-70 | 169.8 +/- 6.7 | Jones-Meade | 18% | No | |
| [M] | Indian | 130 | 15-40 | 166 +/- 7.6 | n/a | n/a | Yes | |
| [N] | Chinese | 180 | 20-79 | 153-181 | Ogilvie | 21% | Yes |
Male DLCO Reference Equations (height = cm, weight = kg)
| Equation | Formula |
| [A] | DLCO = (0.1646 x Height) – (0.219 x age) – 26.34 |
| [B] | DLCO = (0.0984 x height) – (0.177 x age) + 19.93 |
| [C] | DLCO = ((0.1217 x height) – (0.057 x age) – 8.05) x 2.986 |
| [D] | DLCO = (0.284 x height) – (0.246 x age) – 4.625 |
| [E] | DLCO = (0.4192 x height) – (0.1963 x age) – 33.912 |
| [F] | DLCO = (0.3551 x height) – (0.2741 x age) – 11.3527 |
| [G] | DLCO = ((0.0958 x height) – (0.06 x age) – 3.77) x 2.986 |
| [H] | DLCO = (1.062 x height) – (0.229 x age) + 12.9113 |
| [I] | DLCO = (0.32 x height) – (0.13 x age) – 13.07 |
| [J] | DLCO = (0.441 x height) – (0.1938 x age) – 31.3822 |
| [K] | DLCO = ((0.14005 x height) – (0.074 x age) -10.803) x 2.986 |
| [L] | DLCO = (0.3874 x height) – (0.1961 x age) – 21.8982 |
| [M] | DLCO = ((0.126 x height) – (0.0004 x age^2) – 11.236) x 2.986 |
| [N] | DLCO = (0.3028 x height) – (0.2323 x age) + (0.1132 x weight) – 21.8743 |
Female DLCO Reference Equation Study Parameters
| Equation | Ethnicity | No. | Ages | Heights | BHT | FIO2 | HGB Corrected | |
| [A] | Caucasian | 122 | 17-84 | 146-178 | Ogilvie | 25% | Yes | |
| [B] | Caucasian | 98 M+F | n/a | n/a | Ogilvie | n/a | n/a | |
| [C] | Caucasian | 185 | 15-70 | 164.4 +/- 6 | Jones-Meade | 20.9-21.9% | Yes | |
| [D] | Caucasian | 327 | 20-79 | n/a | Ogilvie | n/a | No | |
| [E] | Chinese | 309 | 18-80 | 133-174 | Jones-Meade | 21.1% | Yes | |
| [F] | Hispanic | 99 | 25+ | n/a | ESP | 21% | Yes | |
| [G] | Caucasian | 102 | 25-74 | n/a | n/a | n/a | Yes | |
| [H] | Caucasian | 130 | n/a | n/a | Ogilvie | n/a | Yes | |
| [I] | Brazilian | 50 | 20-80 | n/a | n/a | 21% | No | |
| [J] | Caucasian | 469 | 19-64 | 157.5 +/- 5.7 | ESP | 20% | No | |
| [K] | Caucasian | 96 | 18-86 | 146-177 | n/a | 21% | No | |
| [L] | Caucasian | 167 | 20-70 | 158 +/- 6.4 | Jones-Meade | 18% | No | |
| [M] | Indian | 117 | 15-40 | 152 +/- 5.3 | n/a | n/a | Yes | |
| [N] | Chinese | 126 | 20-79 | 147-172 | Ogilvie | 21% | Yes |
Female DLCO Reference Equations (height = cm, weight = kg)
| Equation | Formula |
| [A] | DLCO = (0.256 x Height) – (0.144 x age) – 8.36 |
| [B] | DLCO = (0.1118 x height) – (0.177 x age) + 7.72 |
| [C] | DLCO = ((0.0911 x height) – (0.043 x age) – 4.93) x 2.986 |
| [D] | DLCO = (0.238 x height) – (0.153 x age) – 7.781 |
| [E] | DLCO = (-0.0604 x height) – (0.9363 x age) + (height x age x 0.0055) + 33.061 |
| [F] | DLCO = (0.1872 x height) – (0.146 x age) + 3.8821 |
| [G] | DLCO = ((0.0958 x height) – (0.06 x age) – 4.91) x 2.986 |
| [H] | DLCO = (0.16 x height) – (0.1111 x age) + 2.2382 |
| [I] | DLCO = (0.18 x height) – (0.075 x age) + 0.20 |
| [J] | DLCO = (0.1569 x height) – (0.0677 x age) + 5.0767 |
| [K] | DLCO = ((0.07391 x height) – (0.037 x age) – 2.516) x 2.986 |
| [L] | DLCO = (0.1369 x height) – (0.1233 x age) + (0.0917 x weight) + 1.8879 |
| [M] | DLCO = ((0.032 x height) – (0.00068 x age^2) + 2.076) x 2.986 |
| [N] | DLCO = (0.1398 x height) – (0.1691 x age) + (0.1124 x weight) – 1.1088 |
References:
Brusasco V, Crapo R, Viegi G. ATS/ERS task force: Standadisation of lung function testing. Standisation of the single-breath determination of carbon monoxide uptake in the lung. Eur Respir J 2005; 26: 720-735.
Brusasco V, Crapo R, Viegi G. ATS/ERS task force: Standadisation of lung function testing. Interpretive strategies for lung function tests. Eur Respir J 2005; 26: 948-968.
[A] Crapo RO, Morris AH. Standardized single-breath normal values for carbon monoxide diffusing capacity. Am Rev Resp Dis 1981; 123: 185-189.
[B] Gaensler EA, Smith AA. Attachment for automated single-breath diffusing capacity measurement. Chest 1973; 63: 136-145.
[C] Gulsvik A, Bakke P, Humerfelt S, Omenaas E, Tostenson T, Weiss ST, Speizer FE. Single breath transfer factor for carbon monoxide in an asymptomatic population of never smokers. Thorax 1992; 47: 167-173.
[D] Gutierrez C, Ghezzo RH, Abboud RT, Cosio MG, Dill JR, Martin RR, McCarthy DS, Moorse JLC, Zamel N. Reference values of pulmonary function tests for Canadian Caucasians. Can Respir J 2004; 11(6): 414-424.
[E] IP MSM, Lai AYK, Ko FWS, Lau ACW, Ling SO, Chan JWM, Chan-Yeung MMW. Reference values of diffusing capacity on non-smoking Chinese in Hong Kong. Respirilogy 2007; 12: 599-606
[F] Knudsen RJ, Kaltenborn WT, Knudsen DE, Burrows B. The single-breath carbon monoxide diffusing capacity. Am Rev Resp Dis 1987; 135: 805-811.
[G] Marsh S, Aldington S, Williams M, Weatherall M, Shirtcliffe P, McNaughton A, Pritchard A, Beaseley R. Complete reference ranges for pulmonary function tests from a single New Zealand population. New Zealand Med J 2006; 119: N1244.
[H] Miller A, Thornton JC, Warshaw R, Anderson H, Teirstein AS, Selikoff IJ. Single breath diffusing capacity in a representative of Michigan, a large industrial state. Am Rev Resp Dis 1983; 127: 270-277.
Neas LM, Schwartz J. The determinants of pulmonary diffusing capacity in a national sample of U.S. adults. Amer J Respir Crit Care Med 1996; 153: 656-664.
[I] Neder JA, Andreoni S, Peres C, Nery IE. Reference values for lung finction. III. Carbon monoxide diffusing capacity (transfer factor). Braz J Med Biol Res 1999; 32: 729-737.
[J] Paoletti P, et al. Reference equations for the single-breath diffusing capacity. Am Rev Resp Dis 1985; 132: 806-813.
Pesola GR, Sunmonu Y, Hugguns G, Ford JG, Measured diffusion capacity versus predicted equations estimates in blacks without lung disease. Respiration 2004; 71: 484-492.
[K] Roberts CM, MacRae KD, Winning AJ, Adams L, Seed WA. Reference values and prediction equations for normal lung function in a non-smoking white urban population. Thorax 1991; 46: 643-650.
[L] Roca J, Rodrigue-Roisin R, Cobo E, Burgos F, Perez J, Clausen JL. Single-breath carbon monoxide diffusing capacity prediction equations from a Mediterranean population. Am Rev Resp Dis 1990; 141: 1025-1032
[M] Vijayan VK, Kuppurao KV, Venkatesan P, Sankaran K, Prabhakar. Pulmonary function in healthy young adult Indians in Madras. Thorax 1990; 45: 611-615.
[N] Yang SC, Yang SP, Lin PJ. Prediction equations for single-breath carbon monoxide diffusing capacity from a Chinese population. Am Rev Resp Dis 1993; 147: 599-606.

PFT Blog by Richard Johnston is licensed under a Creative Commons Attribution-NonCommercial 4.0 International License.
Hi, Richard. Another excellent article, but I’d like to point out a small error in Gaensler’s male DLco equation. You have (0.0984*$D$1)-(0.117*$B$1)+19.93. The 0.117 should be 0.177: (0.0984*$D$1)-(0.177*$B$1)+19.93.
Thanks Jim! I’ll correct the article and the spreadsheet.
Hello Richard,
I enjoyed reading your informative blog, What’s Normal about DLCO because it was so easy to follow for someone without a medical background.
I had a follow up question. Is 31 a reasonable predicted value for a female, Caucasian about 173 cm? Based on your graph and your comment about equation K being closest to the median this appears about right.
The reason I am asking is my daughter regularly does PFTs. When she turned 21, her predicted value went from 25 to 31 which as you know lowers the DLCO %. I wanted to get your thoughts on this change and range. I should add that her tests are conducted at a children’s hospital, and she has been doing them for more than a decade.
Andrea –
For a female aged 21, 173 cm, 31 ml/min/mmHg is probably about right, or certainly not far from it. The reason there was such a large change for your daughter was that up until age 20 the lab was using a child/adolescent reference equation and when she turned 21 they changed to adult reference equations. There is a obviously a discontinuity between the reference equations but unfortunately this happens for almost all pulmonary function tests as adolescents transition to adults. There is no easy solution for this, and this is because developmental rates (and the relationship between lung capacity and body size) can be quite different from one child to another and chronological age is only part of it. I’d also point out that reference equations don’t come from longitudinal studies (i.e. following a population group over a prolonged period of time) so the ability of child/adolescent reference equations to accurately predict and otherwise handle the transition to adulthood values is only approximate at best.
Regards, Richard
Thank you so much Richard for your immediate response. It was certainly a surprise when we initially saw her DLCO % go from 90% to 75%. I guess the 75% is more realistic for a person her age and height though. We just hope that it stays there or improves. Is there anything a person can do to help the DLCO, like certain exercises? She is currently on a prescribed immune suppressant.
Andrea –
Since she’s on an immune supressant the best thing is to stay on top of all lung infections. A cough or fever needs immediate attention, but I’m sure you already knew that. Whether or not she should wear a mask or simply avoid anybody with a cold or the flu is up to her physicians. Most lung exercises are intended to increase respiratory muscle strength in debilitated individuals or to improve clearance of mucus for individuals with bronchiectasis or cystic fibrosis, and do not have a direct effect on gas exchange. Other than that, the things our mothers told us; eat right, exercise and get plenty of sleep have been shown many times to be the best things for all of us.
Best wishes, Richard
Thanks again Richard for your immediate response. She is very much into exercising which is great!
Good morning, this is the first time I have found this blog and thank you for your very informative words. I have been trying to find out more about TLCO without any success.
I am a 66 year old female and I am diagnosed with NSIP (more cellular than fibrotic). My Spirometry test results are good having been tested earlier this month. FEV(1) is 2.09 (103% predicted – up from 58% predicted in May 2016) and my FVC(L) is 2.22 (91% predicted up from 52 in May ). Both results have increased gradually over the last nine months. However, my TLCO result is 2,74 (39% predicted – up from 25% predicted in May) I am prescribed Mycophenolate and Prednisolone. Clearly something is working but is there any thing that I can do to increase my TLCO result for my next test at the end of March
Vic –
I’m a technologist, not a physician. I can talk about physiology and testing but not really about treatments. TLCO is a measurement of the functional surface area of the lung. Increasing lung expansion (i.e. when your FVC increased from 52% to 91%) should increase surface area, but the increase in TLCO that comes from that isn’t necessarily a reflection of an improvement of what’s happening at the alveolar level. NSIP affects the interstitium between the alveoli and the pulmonary capillaries and causes a decrease in TLCO both by increasing the distance that oxygen has to diffuse through and reducing the pulmonary capillary blood volume and flow. Prednisolone reduces inflammation and may be why your FVC improved. At a guess I suspect your physician thinks that your NSIP has an auto-immune component which may be why they prescribed the Mycophenolate. Whether or not a drug used to treat pulmonary fibrosis such as Perfenidone would be helpful is between you and your physician.
I’m sorry that I can’t be more helpful than that.
Best wishes, Richard
Thank you for the explanation which is very helpful
I have sent in Appeals to VA Diabetic, Sleep Apnea Ischemic Heart Disease, but when these documents were sent in a claim went in also this my DLCO going from 30%-60% after I took a PFT Test. The upgrade should of never been sent in with other appeals. Do you know what I can do to get this claim taken care of?????
Ronald –
See a specialist in VA and SS claims. You need expert help.
– Richard