This is the time of the year when it’s traditional to review the past. That’s what “Auld lang syne”, the song most associated with New Year’s celebrations, is all about. I too have been thinking about the past but it’s not been about absent friends, it’s been about trend reports and assessing trends.
In the May 2017 issue of Chest, Quanjer et al reported their study on the post-bronchodilator response in FEV1. I’ve discussed this previously and they noted that the current ATS/ERS standard for a significant post-bronchodilator change of ≥12% and ≥200 ml penalized the short and the elderly. Their finding was that a significant change was better assessed by the absolute change in percent predicted (i.e. 8%) rather than a relative change.
I’ve thought about how this could apply to assessing changes in trends ever since then. The current standards for a significant change in FEV1 over time (also discussed previously) is anything greater than:
![]()
which is good in that it is a way to reference changes over any arbitrary time period but it also looks at it as a relative change (i.e. ±15%). A 15% change however, comes from occupational spirometry, not clinical spirometry, and the presumption, to me at least, is that it’s geared towards individuals who have more-or-less normal spirometry to begin with.
A ±15% change may make sense if your FEV1 is already near 100% of predicted but there are some problems with this for individuals who aren’t. For example, a 75 year-old 175 cm Caucasian male would have a predicted FEV1 of 2.93 L from the NHANESIII reference equations. If this individual had severe COPD and an FEV1 of 0.50 L (17% of predicted), then a ±15% relative change in FEV1 would ±0.075 L (75 ml). That amount of change is half the acceptable amount of intrasession repeatability (150 ml) in spirometry testing and it’s hard to consider a change this small as anything but chance or noise. It’s also hard to consider this a clinically significant change.
If an 8% change in percent predicted is needed for it to be considered significant, then the FEV1 would have to change by 0.23 L and either decrease to 9% of predicted (0.27 L) or increase to 25% of predicted (0.73 L) which are relative change of ±46%. This much of a change is certainly larger than the limit for intrasession repeatability, and is most likely clinically significant for the individual.
The question that needs to be asked is whether an 15% relative change in percent predicted sets the bar too high for a clinically significant change individuals with near-normal results and at the same time sets it too low for those individuals with severely abnormal results. I think it’s clearly evident that it does for those with abnormal results and it may also be true for those near-normal results.
Does an 8% change in percent predicted make more sense? I think it’s reasonably clear it does for individuals with severely abnormal results and may also for those with near-normal results.
Clinical significance is hard to study however, and usually the best you can do is to look at outcomes. But even this is complicated since outcomes can’t be based solely on one variable (i.e. pulmonary function results). The best we can do is draw some kind of line, and in this instance using a relative change to assess changes over time seems to have serious flaws. It’s possible that changes in Z-scores may be more effective way to look at changes over time, but that will have to wait on future study. At the moment, I’d have to say that looking at changes in percent predicted seems to have fewer flaws than relative change and looks to be a better approach when assessing changes over time.
There are numerous studies on longitudinal changes in pulmonary function but these are mostly concerned with what constitutes a normal change over time or the changes that are typically seen with various lung disorders. The question of what constitutes a significant clinical change from one visit to another for values other than FEV1 hasn’t been studied all that much. The 2005 ATS/ERS statement on interpretation included guidelines for assessing change over different intervals of time for FVC, FEV1 and DLCO (and FEF25-75) but these are based on limited data, and are all based on relative changes. I’m inclined to think that assessing changes in FVC, TLC and DLCO in terms of changes in percent predicted makes as much sense as it does for FEV1.
That however, brings me to trend reports. I was very disappointed that the subject of trend reports wasn’t mentioned in even the slightest way in the recent 2017 recommendations for standardized reports. In my lab (and I suspect most clinical PFT labs as well), the majority of spirometry is performed not so much for diagnostic purposes, but for looking at changes over time. It’s for this reason that trend reports are actually quite important. But as a tool to help assess changes over time, every trend report I’ve ever seen does a remarkably poor job of this. Trend reports usually look something like this:
| FVC | FVC %Pred | FEV1 | FEV1 %pred | |
| 12/29/2017 | 1.02 | 52 | 0.61 | 41 |
| 12/01/2017 | 1.54 | 79 | 0.73 | 48 |
| 10/13/2017 | 1.32 | 67 | 0.67 | 44 |
| 06/15/2017 | 1.23 | 62 | 0.79 | 51 |
| 03/16/2017 | 1.34 | 67 | 0.75 | 49 |
| 11/10/2016 | 1.16 | 57 | 0.77 | 49 |
| 08/04/2016 | 1.31 | 64 | 0.88 | 56 |
| 05/24/2016 | 1.71 | 85 | 1.01 | 64 |
| 03/01/2016 | 1.59 | 79 | 0.99 | 63 |
| 12/29/2015 | 1.17 | 58 | 0.77 | 49 |
| 06/29/2015 | 1.53 | 74 | 0.84 | 53 |
| 09/15/2014 | 1.58 | 75 | 0.92 | 56 |
| 05/22/2014 | 1.46 | 69 | 0.81 | 50 |
| 11/21/2013 | 1.89 | 90 | 1.08 | 67 |
| 06/06/2013 | 1.58 | 74 | 1.00 | 60 |
| 03/25/2013 | 1.38 | 65 | 0.84 | 51 |
And when shown graphically, usually look something like this:
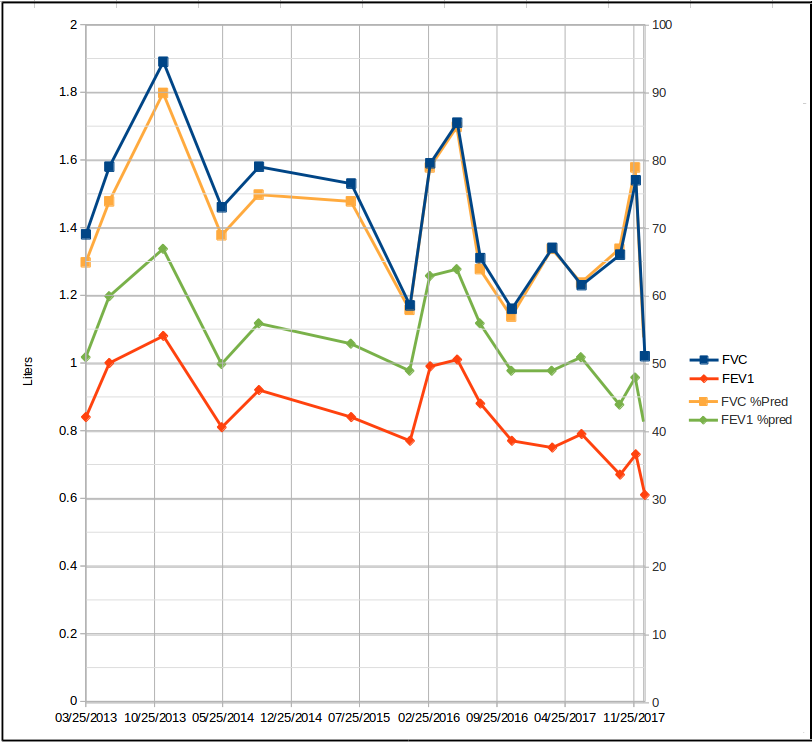
Neither of these formats is terribly useful. When looking at the tabular version you’ve need to have a calculator on hand in order to determine how big a change has actually occurred from visit to visit. The graphical version isn’t much of an improvement partly since the lines are jumbled together and it’s hard to read but also because even though you can see changes when they’re large enough, assessing their actual magnitude is difficult.
Conceptually, at least, there’s an easy fix for the tabular report format (although it isn’t possible to do this with my lab’s software, so it’s a moot point for me). Just adding %change (relative change) or a percent predicted change to the columns makes it much easier do assess changes overall.
For relative change this would look like:
| FVC | FVC %Pred | FVC %Change | FEV1 | FEV1 %pred | FEV1%Change | |
| 12/29/2017 | 1.02 | 52 | -34 | 0.61 | 41 | -16 |
| 12/01/2017 | 1.54 | 79 | +17 | 0.73 | 48 | +9 |
| 10/13/2017 | 1.32 | 67 | +7 | 0.67 | 44 | -15 |
| 06/15/2017 | 1.23 | 62 | -8 | 0.79 | 51 | +5 |
| 03/16/2017 | 1.34 | 67 | +16 | 0.75 | 49 | -3 |
| 11/10/2016 | 1.16 | 57 | -11 | 0.77 | 49 | -13 |
| 08/04/2016 | 1.31 | 64 | -23 | 0.88 | 56 | -13 |
| 05/24/2016 | 1.71 | 85 | +8 | 1.01 | 64 | +2 |
| 03/01/2016 | 1.59 | 79 | +36 | 0.99 | 63 | +29 |
| 12/29/2015 | 1.17 | 58 | -24 | 0.77 | 49 | -8 |
| 06/29/2015 | 1.53 | 74 | -3 | 0.84 | 53 | -9 |
| 09/15/2014 | 1.58 | 75 | +8 | 0.92 | 56 | 14 |
| 05/22/2014 | 1.46 | 69 | -23 | 0.81 | 50 | -25 |
| 11/21/2013 | 1.89 | 90 | +20 | 1.08 | 67 | +8 |
| 06/06/2013 | 1.58 | 74 | +14 | 1.00 | 60 | +19 |
| 03/25/2013 | 1.38 | 65 | 0 | 0.84 | 51 | 0 |
and for percent predicted change this would look like:
| FVC | FVC %Pred | FVC %Pred Chg: | FEV1 | FEV1 %pred | FEV1 %Pred Chg | |
| 12/29/2017 | 1.02 | 52 | -27 | 0.61 | 41 | -15 |
| 12/01/2017 | 1.54 | 79 | +12 | 0.73 | 48 | +9 |
| 10/13/2017 | 1.32 | 67 | +5 | 0.67 | 44 | -14 |
| 06/15/2017 | 1.23 | 62 | -5 | 0.79 | 51 | +4 |
| 03/16/2017 | 1.34 | 67 | +10 | 0.75 | 49 | 0 |
| 11/10/2016 | 1.16 | 57 | -7 | 0.77 | 49 | -13 |
| 08/04/2016 | 1.31 | 64 | -21 | 0.88 | 56 | -13 |
| 05/24/2016 | 1.71 | 85 | +6 | 1.01 | 64 | +2 |
| 03/01/2016 | 1.59 | 79 | +21 | 0.99 | 63 | +29 |
| 12/29/2015 | 1.17 | 58 | -16 | 0.77 | 49 | -8 |
| 06/29/2015 | 1.53 | 74 | -1 | 0.84 | 53 | -5 |
| 09/15/2014 | 1.58 | 75 | +6 | 0.92 | 56 | +12 |
| 05/22/2014 | 1.46 | 69 | -21 | 0.81 | 50 | -25 |
| 11/21/2013 | 1.89 | 90 | +16 | 1.08 | 67 | +12 |
| 06/06/2013 | 1.58 | 74 | +9 | 1.00 | 60 | +18 |
| 03/25/2013 | 1.38 | 65 | 0 | 0.84 | 51 | 0 |
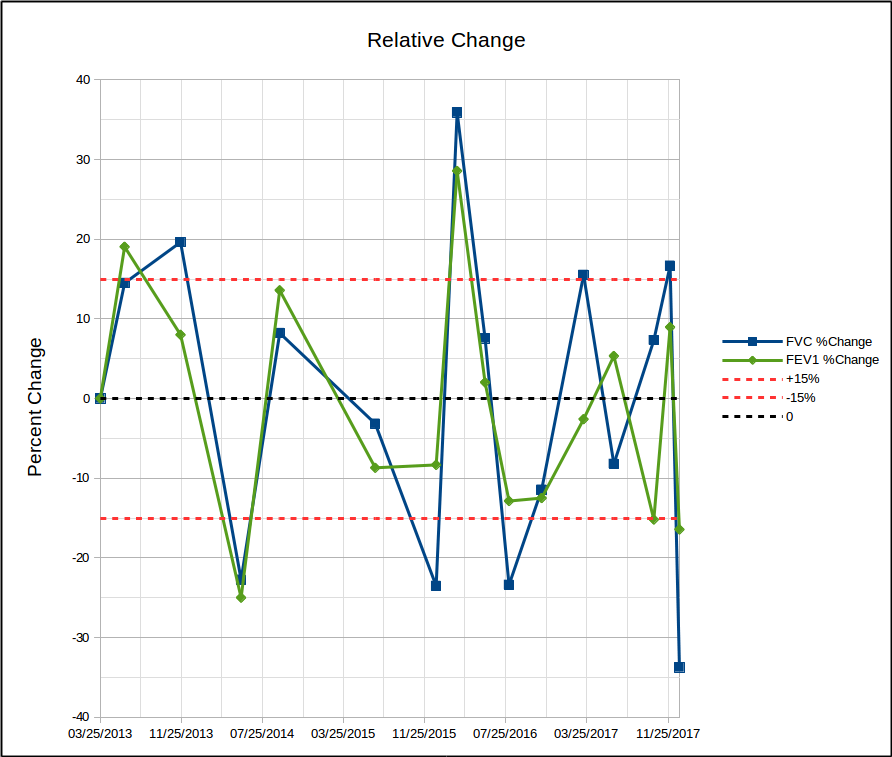
Since it is the amount of change that’s important, it would seem that’s all that would need to be shown on a graph. Depending on whether you’re more interested in relative change or percent predicted change, this could look like this:
or this:

In either case, showing the level of change that’s considered significant makes it easy to see when it is and when it isn’t.
It’s always seemed to me that my lab’s reporting software was an afterthought. The tools I have for formatting and managing reports continues to be crude, limited, time-consuming and rarely updated. This applies just as much (if not more so) to trend reports, and is just one of the reasons I was disappointed at the limited scope of the 2017 ATS reporting standards.
One of the primary purposes of routine pulmonary function testing is to monitor changes due to the progression of a lung disease or it’s treatment. Despite this fact, far more attention has been paid towards the initial diagnosis than to assessing changes over time. Assessing trends is important and there are easy ways to fix trend reports and make them a lot more useful but here we are, well into the 21st century and I still have to keep a pocket calculator on hand so that I can calculate the percent change when I review reports, something that hasn’t changed for decades. This may be the time of year to think about the past but it’s also clear that in many ways we’re still stuck there.
References:
Brusasco V, Crapo R, Viegi G. ATS/ERS Task Force: Standardisation of lung function testing. Standardisation of spirometry. Eur Respir J 2005; 26: 319-338.
Brusasco V, Crapo R, Viegi G. ATS/ERS Task Force: Standardisation of lung function testing. Interpretive strategies for lung function tests. Eur Respir J 2005; 26: 948-968.
Culver BH, Graham BL, Coates AL, et al. Recommendations for a standardized pulmonary function reports. Am J Respir Crit Care Med 2017; 196(11): 1463-1472
Quanjer P, Ruppel GL, Langhammer A, et al. Bronchodilator response in FVC is larger and more relevant than FEV1 is severe airflow obstruction. Chest 2017; 151(5): 1088-1098.
Townsend, MC. ACOEM Guidance Statement. Spirometry in the occupational health setting – 2011 update. J Occup Env Med 2011; 53(5): 569-584

PFT Blog by Richard Johnston is licensed under a Creative Commons Attribution-NonCommercial 4.0 International License
Hi, Richard.
Thank you for articulately calling attention to this issue; I couldn’t agree more. Working in a cancer center where the majority of patients receive serial pulmonary measurements, trend reporting is extremely important, because the amount of change from baseline measurements determine if a particular therapy will be continued or changed. I am fortunate because the producer of our software, Morgan Scientific, recognizes the importance of trend reports and has addressed many of the points you’ve raised, and continues to improve this aspect of their reporting (full disclosure: I have no financial interest nor are paid in any manner by Morgan Scientific).
Thank you for sharing your expertise in these blogs, and have a great new year.