The 2005 ATS/ERS spirometry standard make it permissible and even recommends that the FVC and FEV1 be selected from different efforts. I disagree somewhat with their criteria for selecting the FEV1 but overall reporting composite results makes a lot of sense. In an ideal world we’d always get the best FVC and FEV1 in a single effort but what we more often get is a good FEV1 with a poor FVC or a poor FEV1 with a good FVC. So, it best serves the clinical needs of the patient to report the best elements from multiple spirometry efforts.
However, I was disappointed that the 2017 ATS reporting standards did not in any way address how to indicate that composite results are being reported, nor does it resolve the selection of the flow-volume loops and volume-time curves that accompany the numerical results. That leaves it to us to decide how to do this but this in turn is often limited by the capabilities of our equipment’s software.
One test system that I routinely take to a free spirometry screening clinic will only report the three “best” efforts based solely on the largest combined FVC + FEV1. Admittedly, to some extent this follows the 2005 ATS/ERS spirometry standards selection criteria but other than deleting a specific test effort I cannot override these selections nor can I mix and match the FVC and FEV1 values. This means that what it reports as the “best” effort doesn’t always agree with what in reality are the best results.
My lab’s software however, allows us to select which test efforts the FVC and FEV1 come from. In addition we can select which test effort the ancillary measurements (Peak Flow, Expiratory Time, FIVC, FEF50, etc.) and which effort the flow-volume loop and volume-time graphs comes from.
It is therefore possible to select the FVC, FEV1, ancillary measurements and the graphs from entirely different test efforts. Thankfully, this almost never done but when I review reports what I see most frequently is that the FVC is selected from one test effort, but the FEV1, ancillary measurements and graphs are selected from another. To some extent this makes sense because I’d usually agree that the Peak Flow should always be associated with the FEV1, and if that’s the case, then so should the flow-volume loop. The problem with this is that the FVC often comes from a test effort with a substantially longer expiratory time and when results are selected this the volume-time curve and expiratory time are instead reported for the effort the FEV1 came from.
This leads to a report that look like this:
| Observed: | Predicted: | %Predicted: | |
| FVC: | 2.62 | 3.65 | 72% |
| FEV1: | 2.01 | 2.58 | 78% |
| FEV1/FVC: | 77 | 72 | 107% |
| Peak Flow: | 8.83 | 6.73 | 131% |
| Exp. Time: | 1.20 |
with graphs like:
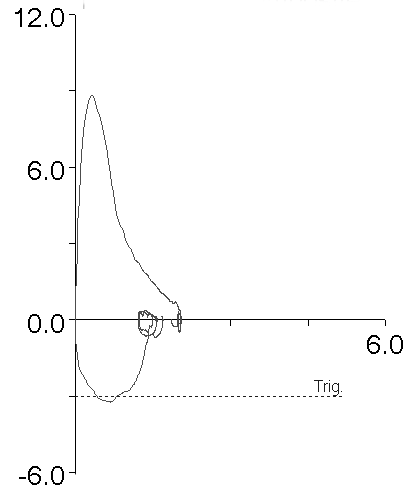
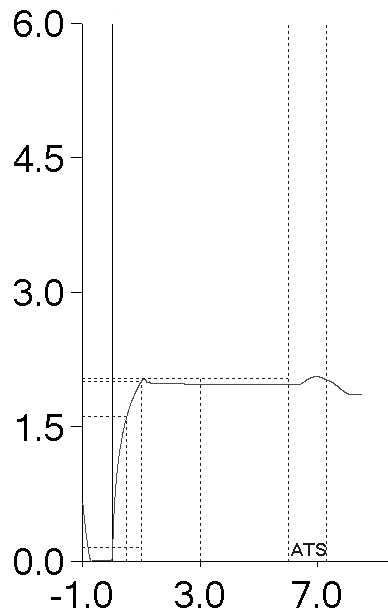
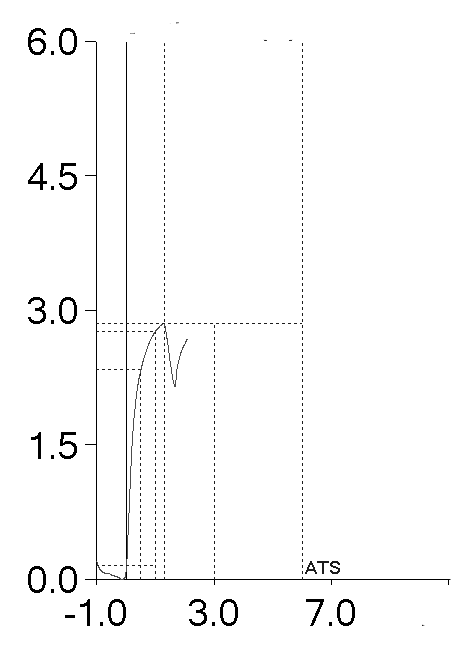
At first glance these results are typical of restriction but anybody who reads this report and who knows anything about PFTs would see the short expiratory time and immediately suspect that the FVC is underestimated and the FEV1/FVC ratio overestimated, probably by a fair amount. For this reason, the test effort would probably be considered suboptimal and more likely to be masking underlying airway obstruction instead. However, because the expiratory time and the volume-time graph are coming from the effort with the highest FEV1 they are misleadingly low. If the proper expiratory time and volume-time curve were reported, it would look like this which goes a long way toward clearing up the confusion:
| Observed: | Predicted: | %Predicted: | |
| FVC: | 2.62 | 3.65 | 72% |
| FEV1: | 2.01 | 2.58 | 78% |
| FEV1/FVC: | 77 | 72 | 107% |
| Peak Flow: | 8.83 | 6.73 | 131% |
| Exp. Time: | 8.76 |
However, as I mentioned Peak Flow and Expiratory Time are part of the ancillary measurements and can’t be selected separately. The same applies to the flow-volume loop and the volume-time curve.
So when this happens I take a look at all of the patient’s test efforts. In this specific case, it just happened that the test effort with the largest FVC had a peak flow comparable to the test effort the largest FEV1 came from. That allowed me to select the ancillary measurements (Peak Flow and Expiratory Time) and a combined flow-volume loop and volume time curve that matched the reported results.
I’m not always so lucky. For example, this report has similar problems:
| Observed: | Predicted: | %Predicted: | |
| FVC: | 3.30 | 4.24 | 78% |
| FEV1: | 2.77 | 3.12 | 89% |
| FEV1/FVC: | 84 | 74 | 114% |
| Peak Flow: | 8.31 | 8.11 | 102% |
| Exp. Time: | 1.35 |
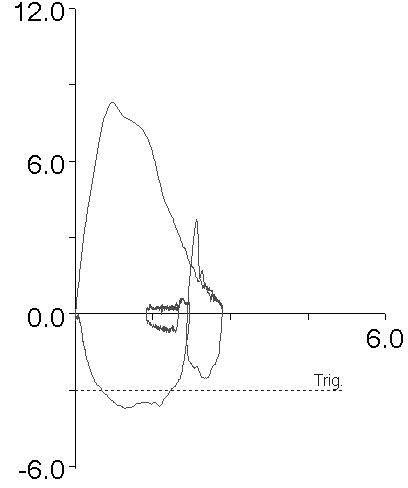
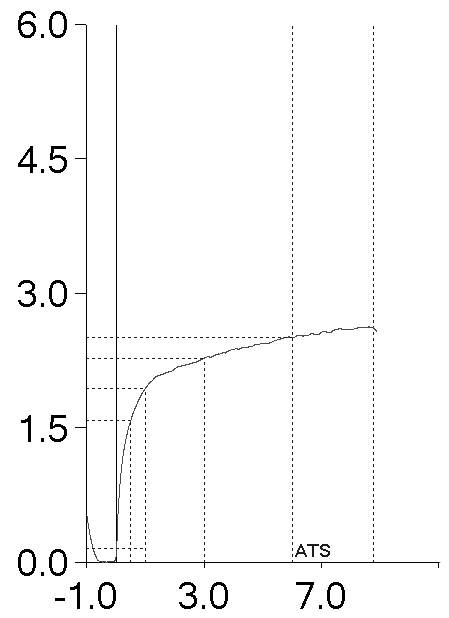
But all of the patient’s other test efforts had substantially lower Peak Flows, and even though the effort the FVC came from had the next best Peak Flow, the flow-volume loop looked substantially different:
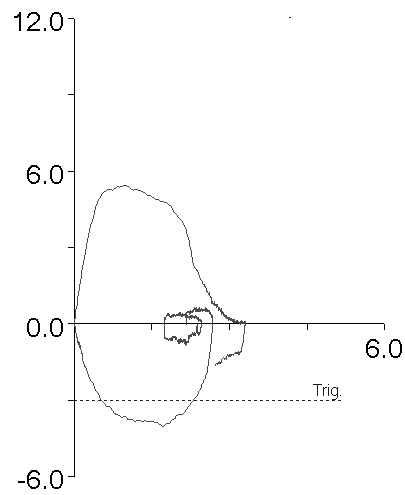
In this case I pretty much had to leave the original report alone. If I could have selected the flow-volume loop and volume-time graphs separately and the Peak Flow and Expiratory Time separately, the report would have made a lot more sense.
When I review reports with problems I find that I can “fix” them about 1/3 of the time. So why bother even looking to fix reports in the first place when most of the time I can’t?
Our PFT reports tell a story. There’s no character development, no scenes and no particular plot, but it’s still a story. It’s important that the elements of the story support each other and have a coherent narrative. When the elements are at odds with each other then the story doesn’t make a lot of sense, even if the “real events” the story is taken from do.
I’d be able to tell the patient’s stories better if I could be more specific in what elements I could select from each test effort but there I’m limited by what our lab software allows me to do. It would also been helpful if the 2017 ATS reporting standards addressed the issue of reporting composite results since this is something we have to deal with every day.
I’d like the stories my lab tells to be coherent, believable and clinically relevant rather than something that appears to be a flight of fancy. That’s why it’s worth my time to try to re-work a report even when most of the time our lab’s software won’t let me.
So, what kind of stories are your lab’s reports telling?
References:
Brusasco V, Crapo R, Viegi G. ATS/ERS Task Force: Standardisation of lung function testing. Standardisation of spirometry. Eur Respir J 2005; 26: 319-338.
Culver B H et al. Recommendations for a standardized pulmonary function reports. An official American Thoracic Society technical statement. Am J Respir Crit Care Med 2017; 196(11): 1463-1472.

PFT Blog by Richard Johnston is licensed under a Creative Commons Attribution-NonCommercial 4.0 International License
Richard,
I would like to know your expert opinion on the following questions related to Sporometry.
– Why we need to hold bronchodilators prior to spirometry, if there is no significance for bronchodilator reversibility? Data showed even normal people can show some degree of reversibility. Also, it can not differentiate asthma and COPD, and has no prognostic value.
– Why can’t we consider slow vital capacity routinely in spirometry? Slow vital capacity is easy to perform for people struggle with forced expiratory maneuvers. Some studies showed FEV1/SVC significance in diagnosing obstructive airway disease in obese individuals.
Thank you
–
Sateesh –
The ATS/ERS currently considers a positive bronchodilator response to be +12% (and > 0.20 L) for either FVC or FEV1. There is at least one group of researchers that advocate changing this to a +8 percent predicted change because the ATS/ERS standards tend to overestimate bronchodilator response in the tall and young and underestimate it in the elderly and short. So although there may be some debate about it there are standards for assessing a positive bronchodilator response.
To some extent the GOLD COPD standards use the lack of bronchodilator response in individuals with airway obstruction as a definitive sign of COPD. The problem with this is that asthma often has an inflammatory component that does not respond to a bronchodilator but may instead respond to prolonged use of inhaled steroids. For this reason even though the physicians I work with take a positive bronchodilator response as a sign of asthma they don’t use the lack of a bronchodilator response as an indication that asthma is not present. I will also mention that when my lab has somebody referred for a methacholine challenge who hasn’t had pre- and post-bronchodilator spirometry we perform that a week or two ahead of the methacholine challenge. If they have a positive bronchodilator response we cancel the methacholine challenge. Realistically a positive or a negative bronchodilator response is only one piece of evidence that is used to diagnose and treat patients. Sometimes it’s informative, sometimes it isn’t.
The ATS/ERS standards for interpretation actually recommend the use of the FEV1/VC ratio regardless of the source of the VC. I think there are a variety of patients who have difficulty with the FVC maneuver who would benefit diagnostically from the performance of both FVC and SVC maneuvers and I routinely use the FEV1/SVC or FEV1/IVC ratio whenever the SVC or IVC is larger than the FVC. However, none of the population studies used to generate reference equations for spirometry (and I speak most specifically of NHANESIII and GLI) have normal values or an LLN for the FEV1/SVC ratio. Since SVC does tend to be larger than FVC and the discrepancy increases with age, there is a potential for over-diagnosing airway obstruction.
I have to point out that performing both FVC and SVC tests require more time than just FVC and it’s probably not necessary to perform both tests on all patients. Although I have my own notions about when an SVC should be reported there are no accepted standards for this and I don’t remember seeing any studies that have attempted to address this point. One final issue is that not all test systems will calculate and report the FEV1/SVC ratio and as an example my lab’s test systems cannot do this. This means that when we do this, we have to calculate it manually and put it in the notes.
Regards, Richard
Thank you Richard. This is useful.
I agree SVC is an ignored variable in the pulmonary function research. I am glad the recent ATS/ ERS document recommended it’s use when obstruction is suspected.
I would also like to know your view on the latest GOLD recommendation ‘Assessment of the presence or absence of airflow obstruction based on a single measurement of the post-bronchodilator FEV1/FVC ratio should be confirmed by repeat spirometry on a separate occasion if the value is between 0.6 and 0.8, as in some cases the ratio may change as a result of biological variation when measured at a later interval (Aaron et al., 2017; Schermer et al., 2016) If the initial post-bronchodilator FEV1/FVC ratio is less than 0.6 it is very unlikely to rise above 0.7 spontaneously.(Aaron et al., 2017).”
I guess you might be using LLN in your lab rather fixed ratio for interpretation.
Thanks
Sateesh –
Well, I can’t say there’s anything wrong with confirming a reduced FEV1/FVC ratio, if for no other reason than some individuals have problems performing the FVC maneuver correctly and improve with practice. I’m not sure I’d call that biological variation, however and in fact I think that many researchers underestimate the effect test quality has on the FEV1/FVC ratio, and in particular the effect that the measured FVC has. I’d also have to call into question the final sentence that states that initial post-BD FEV1/FVC ratios less than 0.6 rarely rise above 0.7 and that’s because it’s not uncommon for a patient with poorly treated COPD or asthma to have an exceptionally low FEV1/FVC ratio on their first visit and improve dramatically on subsequent visits after treatment with inhaled medications.
The GOLD standards however, still rely on a fixed FEV1/FVC ratio. The advantage of this is that it is not dependent on a particular reference equation. The disadvantage is that it because the FEV1/FVC ratio normally decreases with age and is lower in tall individuals it over-diagnoses airway obstruction in the elderly and tall and under-diagnoses it in the short and young. I’d also say that although many researchers and educators state that the FEV1/FVC ratio is preserved across different ethnicities and populations, I’ve studied the FEV1/FVC ratio generated by different reference equations and the spread is actually quite broad. Whether this is due to study population, measurement technology or statistical analysis is unclear but it also means that any fixed value of FEV1/FVC is only a line in the sand.
I wish we were using the LLN. I have pushed the pulmonary physicians for several years to allow the lab to change to LLN (and to update a number of our reference equations) but so far they have vetoed this. My guess (since they don’t seem to want to discuss it) is that they prefer continuity to change {sigh}. Resistance to change is a chronic problem around the world.
Regards, Richard