A while back one of our technicians brought a helium dilution FRC graph to my attention and wanted to know if it showed a system leak. At that time my response was that it definitely wasn’t a leak (leaks don’t show increases in helium) and was probably due to too much oxygen being added to the system at the beginning of the test.

A couple of days ago a technician brought a similar graph to me and again I was asked why it looked unusual. I’ve had time to think about this issue since the last time and I’ve come up with an alternate explanation that I think fits the facts a bit better.
A normal helium dilution curve looks something like this:
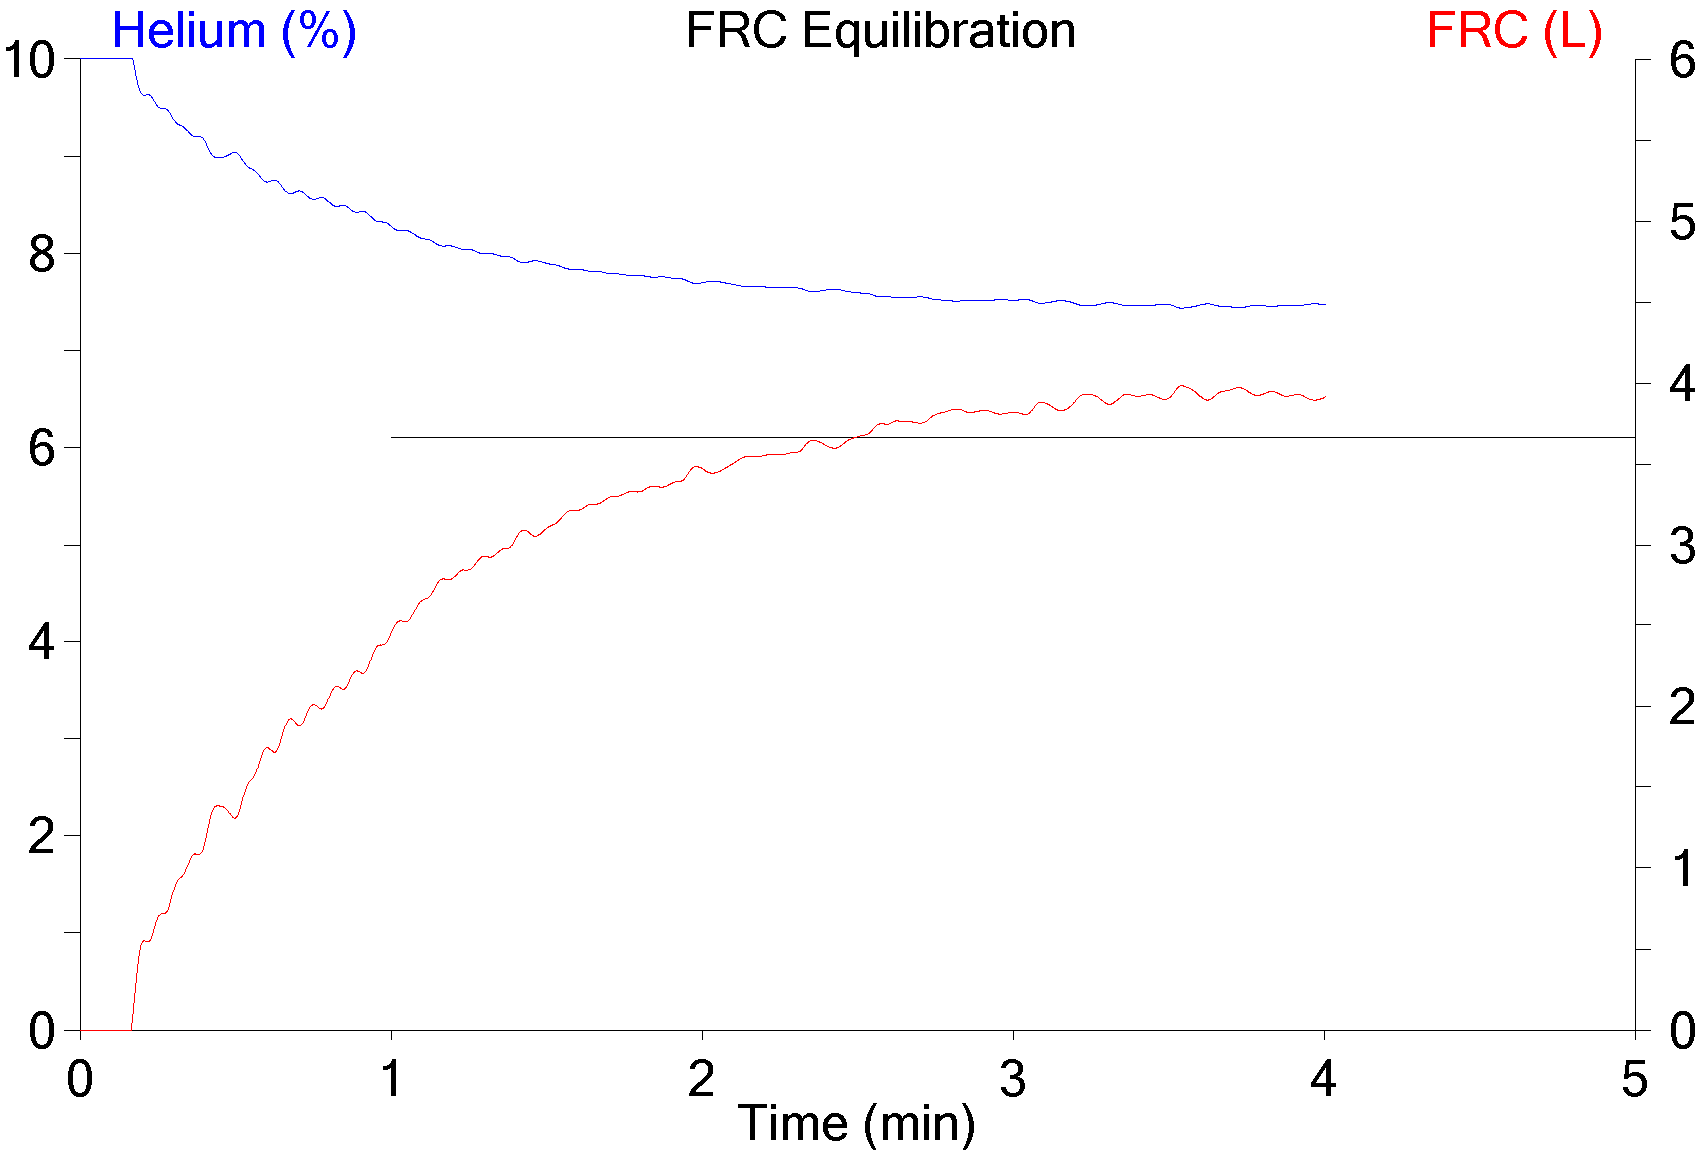
which shows the helium decreasing with what is more or less an exponential decay curve. What’s unusual about the other curve is that it shows a relatively rapid fall to the lowest helium concentration near the beginning of the test and then a slow rise to the final concentration.