In 1844 John Hutchinson published his first paper describing his spirometer and his research on the Vital Capacity. He was the first person to use the word “spirometer” to describe his instrument and the first to use the term “vital capacity” to designate the maximum amount of air an individual can exhale after a maximal inhalation. Although he is remembered as the inventor of the spirometer, he was not the first person to use a gasometer to measure lung volumes nor was he the first to measure the vital capacity. What made his research different from those that came before him was partly the prodigious number of individuals whose vital capacity he measured but far more importantly that he was able to show a clear relationship between standing height, age and vital capacity which had not been previously apparent. This finding galvanized researchers in England, Europe and the United States and in many ways helped set the course of research into lung function for many decades to come.
This clear relationship between standing height and vital capacity has been taken as scientific fact since that time despite inconsistencies not only in Hutchinson’s data but in almost all population studies since that time. The problem is that the relationship between standing height and vital capacity is not precise but only approximate. In order to explain the range of results that appeared in his data Hutchinson and other researchers of his time divided their study population into groups by their occupation. This approach may appear to be quaint to us now but at the time they were very serious both about the utility of doing this and what it told them about the different classes of society.
The first studies on vital capacity that divided the population by race were done in the United States. The reasons that this was done are both simple and complex, and overall there’s not a lot we can look back and be proud of. At that time there was an overwhelming societal concern with the races in general and not only the recently freed black slaves and the Amerindians but also about the different “races” of Europe that were emigrating to the United States. There was much public talk and private thought about the concepts of racial degeneracy, racial mongrelization and racial vitality, and unfortunately the vital capacity was taken as a way of measuring these things. Despite incredibly significant errors in both the methods and conclusions of these studies this approach spread to Europe during the second half of the 19th century and dividing study populations by race has become standard practice ever since.
When I first started doing pulmonary function testing I was taught to decrease the predicted vital capacity by 15% for Blacks and 10% for Asians. Decades later ethnicity-based population studies replaced these fractions. I always took this as the correct way to approach predicted values (and it is embedded in the ATS/ERS standards) but at the same time I’ve always had patients where it was either difficult to assign ethnicity or where their results significantly exceeded their ethnicity-based reference values. Over the last several years I have had the opportunity to study the issues surrounding reference equations extensively and I have become somewhat disenchanted with the notion of ethnicity-based reference equations.
There are several reasons for this. First, and most importantly, what exactly, is ethnicity? Ethnicity may appear to be obvious but vital capacity is primarily related to the height, depth and width of the lungs and to the range of motion of the diaphragm and rib cage. The actual relationship between standing height and vital capacity is due to not only to developmental genes but also to an individual’s diet and environment during the developmental period. I am not going to say that locality-based populations that share a common diet, environment and a high percentage of genes don’t have a similar relationship between standing height and vital capacity (and FEV1, TLC, DLCO etc.). This may be what we think of as ethnicity but the problem is that there isn’t any particularly good way to define it. Is it based on skin color? Presence of an epicanthic fold? The place you were born? The place where your grandparents were born? Even if you can decide what ethnicity actually is the differences in diet, environment and genes that are the hallmarks of any ethnicity are decreasing rapidly worldwide.
Next, even when the vital capacity is studied in the same ethnic group, the differences within that group can equal or even exceed that which is considered to exist between races. Caucasians as an “ethnic” group have had more vital capacity population studies performed than all the other ethnicities put together.
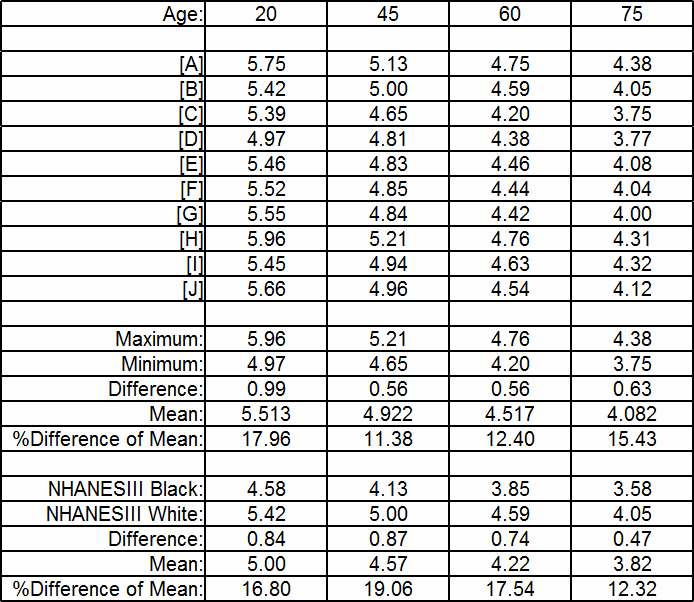
Predicted FVC (L) for 175 cm male Caucasians
Depending on age and using commonly available reference equations, for a 175 cm Caucasian male the differences in the maximum and minimum possible predicted vital capacities range from 0.56 to 0.99 L (which is 11% to 18% of the studies’ mean values). In the NHANESIII study, the differences between Caucasian and Black predicted vital capacities range from 0.47 to 0.87 L (12% to 19% of the predicted mean). How can we consider the difference in predicted FVC from different ethnicities to be so significant and yet it is in the same range as the differences from within a single ethnicity?
Finally, this spirometry report comes from a middle-aged Caucasian female with average height and weight. If you consider the percent predicted results to be acceptable, then we have a problem.

If this patient’s FVC and FEV1 had been 100% of predicted, then we would have said she was completely normal but in reality her FVC would have been 22% less and her FEV1 would have been 28% less than it “should” have been and she would rightly be feeling some distress about her breathing. We may consider an 8% or 12% or 15% difference in predicted FVC between different ethnicities to be terribly significant but the reality is that on an individual basis our ability to accurately predict FVC is actually mediocre at best.
So what can be done to improve this? Surprisingly the reasons for ethnic differences in lung capacity has been studied only a small number of times. Researchers have attempted to use a variety of alternative anthropometric measurements to improve the prediction of vital capacity, notably:
- sitting height
- leg height (standing minus sitting height)
- sitting/standing height ratio
- biacromial width (i.e., horizontal distance across the shoulders measured between the acromia (bony points))
- elbow breadth
- BMI
- chest expansion (difference in chest circumference between TLC and RV)
- arm span
- radiographic measurement of lung height, width, depth and surface area.
Unfortunately, no single study has made all of these measurements in a single group of subjects. In addition the number of subjects in each study was not terribly large and the number of “races” represented were limited and different from study to study. This makes it difficult to assess the significance of results across studies and most of these alternative measurements appear to make only a slight difference in the prediction of FVC.
Not altogether surprising however, radiographic measurements, specifically lung width and surface area, appear to explain many of the differences in FVC (and TLC). Radiographic measurements are a somewhat invasive measurement (annual radiation burden) and it’s not clear to me how standardized these measurements are. Most importantly radiographic measurements of this kind are not at all likely to be commonly available in patients receiving spirometry or other pulmonary function tests.
Sitting height on the other hand is totally non-invasive and reduces the apparent difference in FVC between some ethnicities (but not all) by about a third. Several studies have shown that sitting height has a statistical significance roughly equal to standing height.
I am disappointed to have been unable to find any study of individuals with significantly elevated lung capacity, even outside the context of alternative measurements. It would seem to me that these individuals hold a variety of clues about the anatomical and physiological reasons for lung capacity and that further study of them would improve our ability both to predict lung capacities for any given individual and for “ethnicities” in general.
At the moment however, there doesn’t appear to be an overwhelming good reason to replace standing height and ethnicity-based reference equations but this also doesn’t mean we should stop looking. To me the goal would be one or more anthropometric measurements that could be made relatively easily and that would make it unnecessary to determine ethnicity. I don’t think we’ve exhausted all of the possible alternative anthropometric measurements that could be made. I also don’t think that a large enough group of subjects has been studied with a sufficient number of alternative measurements and ethnicities.
I am concerned that because we “know” that differences in the relationship between standing height and lung capacity are due to “race” and “ethnicity” that we are not looking to see anything different. I am particularly concerned that simple alternative measurements such as sitting height and arm span are not routinely made or statistically analyzed in ongoing population studies. It may turn out that these (and other) alternative anthropometric measurements are not a statistically significant improvement over standing height, but as long as we continue to look only at standing height we will never find an alternative.
Genes, diet and environment likely have a powerful effect on the relationship between standing height and lung capacity. The degree to which each of these affects this relationship is unclear but as world populations become ever more urbanized and interconnected regional differences in all of these factors is decreasing. Our current approach towards assessing lung capacity based on ethnicity is flawed for a variety of reasons and we need to keep this in mind when we assess the results of our testing.
References:
Braun L. Breathing race into the machine: The surprising career of the spirometer from plantation to genetics. University of Minnesota Press, 2014.
Donnelly PM, Yang T-S, Peak JK, Woolcock AJ. What factors explain racial differences in lung volume? Eur Respir J 1991; 4: 829-838.
[A] Gutierrez C, et al. Reference values of pulmonary function tests for Canadian caucasians. Can Respir J 2004; 6: 414-424.
[B] Hankinson JL, Odencrantz JR, Fedan, KB. Spirometric reference values from a sample of the general U.S. Population. Amer J Resp Crit Care 1999; 159: 179-187
Harik-Khan RI, Fleg JL, Muller DC, Wise RA. The effect of anthropometric and socioeconomic factors on the racial difference in lung function. Am J Resp Crit Care Med 2001; 164: 1647-1654.
Jacobs DR, Nelson ET, Dontas AS, Keller J, Slattery ML, Higgins M. Are race and sex differences in lung function explained by frame size? Am Rev Resp Dis 1992; 146: 644-649.
[C] Knudson RJ, Lebowitz MD, Holberg CJ, Burrows B. Changes in the normal maximal expiratory flow volume curve with growth and aging. Am Rev Resp Dis 1983; 127: 725-734
Korotzer B, Ong S, Hansen JE. Ethnic differences in pulmonary function in health nonsmoking Asian-Americans and European-Americans. Am J Resp Crit Care Med 2000; 161: 1101-1108.
[D] Kuster SP, Kuster D, Schindler C, Rochat MK, Braun J, Held L, Brandli O. Reference equations for lung function screening of healthy never-smoking adults aged 18-80 years. Eur Respir J 2008; 31: 860-868.
Louw SJ, Goldin JG, Joubert G. Spirometry of healthy adult South African men. SAMJ 1996; 86(7): 814-819.
[E] Morris JF, Koski A, Johnson LC. Spirometric standards for healthy nonsmoking adults. Am Rev Resp Dis 1971; 103: 57-67.
[F] Morris JF, Koski A, Temple WP, Claremont A, Thomas DR. Fifteen-year interval spirometric evaluation of the Oregon Predictive equations. Chest 1988; 93: 123-27
[G] Johannessen A, Lehmann S, Omenaas ER, Side GE, Bakke PS, Gulsvik A. Post-bronchodilator spirometry reference values in Adults and implications for disease mangement. Amer J Resp Crit Care Med 2006; 173(12): 1316-1325
[H] Marsh S, Aldington S, Williams M, Weatherall M, Shirtcliffe P, McNaughton A, Pritchard A, Beaseley R. Complete reference ranges for pulmonary function tests from a single New Zealand population. New Zealand Med J 2006; 119: N1244.
[I Pereira CADC, Sato T, Rodrigues SC. New Reference Values for forced spirometry in white adults in Brazil. J Bras Pneumol 2007; 33: 397-406.
[J] Roberts CM, MacRae KD, Winning AJ, Adams L, Seed WA. Reference values and prediction equations for normal lung function in a non-smoking white urban population. Thorax 1991; 46: 643-650.
Schwartz J, Katz SA, Fegley RW, Tockman MS. Sex and race differences in the development of lung function. Am Rev Resp Dis 1988; 138: 1415-1421.
Withers RT, Bourdon PC, Crockett A. Lung volume standards for healthy male lifetime nonsmokers. Chest 1988; 92(1): 91-97.

PFT Blog by Richard Johnston is licensed under a Creative Commons Attribution-NonCommercial 4.0 International License
Hello Mr Johnston,
Your thoughts about “race” and “ethnicity” as used in pulmonary function testing are interesting. In particular, your mention of sitting height and your statement that you “have become somewhat disenchanted with the notion of ethnicity-based reference equations” both reminded me of a letter to the Editor of Respiratory Care that I wrote more than 30 years ago. Here’s the reference: Green J. Race-Specific Predictions–Misguided Effort? Respir Care 1984;29:1245. If I were writing it now, I might express the ideas differently, but I think the main point probably till holds. It certainly is disappointing to find out out how little progress there’s been in the decades since then.
Thanks for your blog. I enjoy reading it.
JG