I’ve mentioned previously that the PFT Lab I am associated with recently went through a major hardware and software update. As part of this update we decided to change spirometry predicted equations to NHANESIII. The lab has used the Morris equations for at least the last 25 years and this has caused us to revisit a number of issues associated with interpretation of results, one of which is age.
The software update included the NHANESIII equation set but when we selected it we found that the software would not calculate predicted values for patients over the age of 80. The manufacturer said that this was because that was as far as the age range went in the original NHANESIII study and for this reason they could not extend it. Furthermore, their recommendation was to use the Crapo or Knudsen equations for ages above 80 because they were “more linear”.Our PFT Lab has a substantial population of patients who are older than 80 and I suspect that this is true for many other PFT Labs as well. Our decision was to use the NHANESIII equations for all ages because the study they came from has the largest number of well characterized subjects and that the results were extensively analyzed. We also felt that using a different equation set above 80 would lead to discontinuities in the predicted values.
I was able to modify the age limits imposed by the manufacturer on the NHANESIII equations but also decided to investigate the issue of age and prediction equations further.
The ATS/ERS indicates that it is the responsibility of each PFT Lab to choose for itself which equation set matches its local population but I’ve always wondered how it is possible to do this. Even if you are capable of performing an adequate statistical analysis (something I am not sure I could do), most patients seen in a pulmonary function lab are there because they are having respiratory problems and if you try to select only “normal” patients for analysis how are you determining they are “normal”? This is even more difficult when considering patients above the age of 80 because being survivors they already are, by definition, outliers.
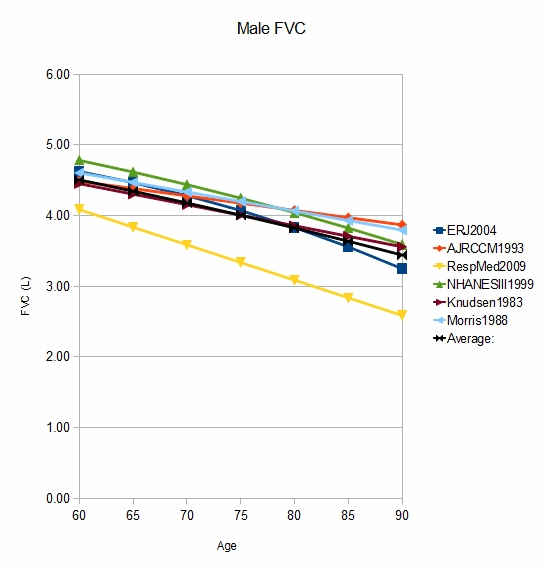
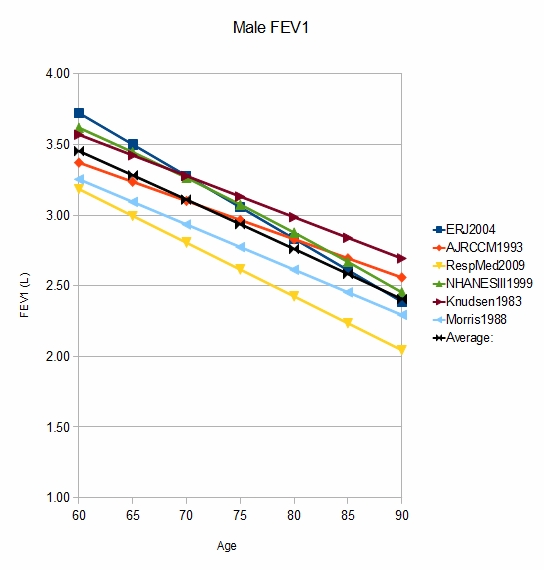
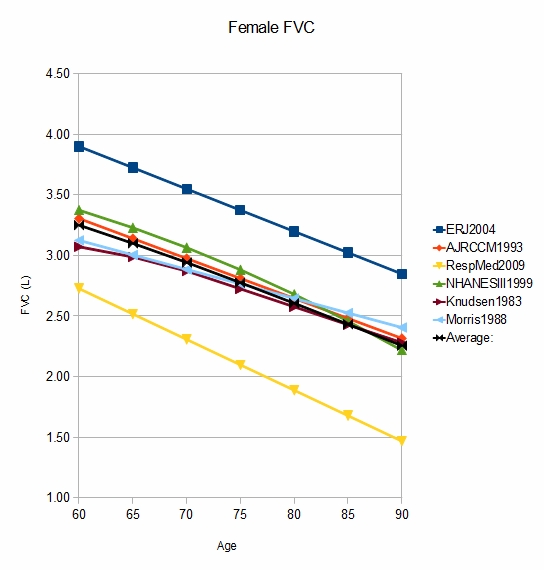
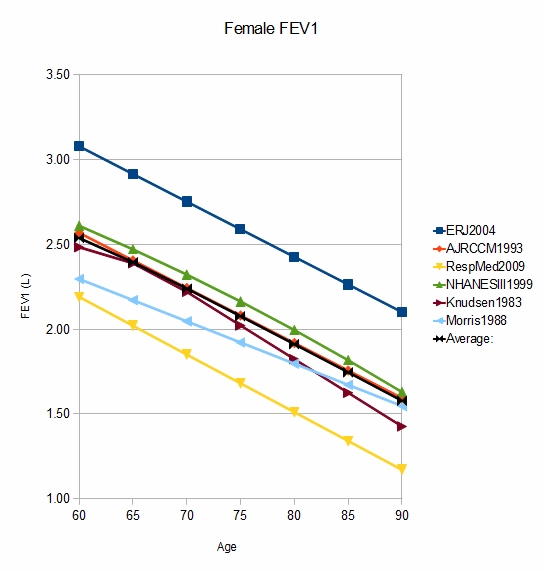
I was able to find three studies with a subject population between the ages of 65 and 85 and entered their equations into a spreadsheet. To be able to compare them to more conventional studies I also entered the equations for NHANESIII, Knudsen and Morris and then graphed the results.
What was first evident is that patient height makes a big difference in the distribution of the predicted values. Depending on what height you are looking at, the question as to which equations produce the highest values and which produce the lowest values changes. No single equation set was always highest or always lowest. In order to look at just the effect of age I chose to look at the values from the average height for men (178 cm) and women (164 cm).
Using age 75 as a point of comparison since that is an age within all predicted sets, for males there was one equation set that was an excessively low for both FVC and FEV1 when compared to the other studies. If those results are ignored, the male FVC values clustered within 0.24 L and FEV1 clustered within 0.36 L. For females at age 75 there was both an excessively low (same set as males) and an excessively high set of equations. If those results are ignored the FVC values clustered within 0.16 L and the FEV1 clustered within 0.12 L. This at least gives an indication that these studies may not be all that different from each other. Interestingly all of the outlying male and female values were from the elder population studies.
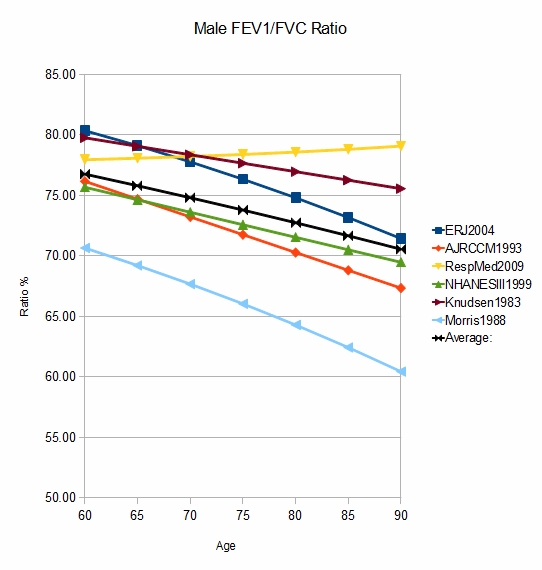
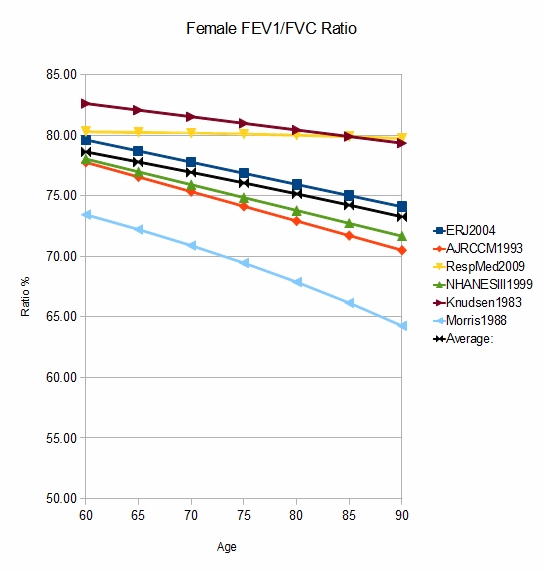
However, although the actual FVC and FEV1 values are of course important, when judging obstruction the FEV1/FVC ratio is critical. Looking at this it is evident that the underlying equations and data sets from several studies appear to have problems. We could argue about the actual slope that the FEV1/FVC ratio takes with advancing age but a ratio that rises or remains essentially unchanged should be viewed with suspicion. As importantly, when these are taken out of the mix and the remaining ratios are considered there is actually quite a broad range of predicted ratios. The highest value for males was about 79% and the lowest was about 66%. For females the highest predicted ratio was 81% and the lowest about 68%. I find this excessively broad range of predicted FEV1/FVC ratio to be concerning, particularly for the implications it has about including or excluding a diagnosis of airway obstruction.
Is a linear equation more accurate for the elderly than one that uses exponentials and shows an increasing rate of decrease with age? Up to age 80 the NHANESIII data set shows an accelerating rate of decrease and notably Knudsen as well has a different equation for females above the age of 70 than it has below that age, and the rate of decrease is higher for the over 70 equations. All of the equations from the elder studies of spirometry are linear but that may be an aspect of the limited age range and number of subjects in each study rather than a true indication.
I am not sure that looking at the equations from the elder spirometry studies was at all helpful. These studies were limited and the results from their equation sets tended to be the outliers, both high and low. Having said that, even if the results from those equation sets are ignored there are still substantial differences in the FEV1/FVC ratio amongst the remaining equation sets. For that reason I think that anybody evaluating new equation sets should pay close attention to the predicted FEV1/FVC ratios because they showed far greater differences there than did the predicted FVC and FEV1. That doesn’t mean that a more realistic predicted FEV1/FVC ratio means that the predicted FVC and FEV1 are also realistic but I think it is a good first step.
I would also suggest avoiding the thought that any equation set that is closest to the average of other equation sets is more likely to be the “best” equation set. Given the differences in populations and the number of subjects between studies this is more like comparing apples to oranges than not.
There are professionals in our field who have spent their entire career exploring the issue of predicted values. Selection of a proper equation set is a long-standing conundrum and as it’s been said, you can’t solve a conundrum, you can only survive it. Any equation set is a line drawn in the sand and I hope that any staff involved in the review and interpretation of results realizes this. Our choice was to use the NHANESIII equation set because it is the largest and best characterized study of its kind. The PFT Lab I am associated with sees a very cosmopolitan population, with broad range of races and ethnicities and I think this was the best choice we could make. PFT Labs that see a more homogeneous population may well find a different equation set to be more appropriate.
References:
Enright P, Kronmal RA, Higgins M, Schenker M, Haponik EF. Spirometry reference values for women and men 65 to 85 years of age. Am Rev Respir Dis 1993; 147: 125-133.
Garcia-Rio F, Pino JM, Dorgham A, Villamor AJ. Spirometric reference equations for European females and males aged 65-85 years. Eur Respir J 2004; 24: 397-405.
Hankinson JL, Odencrantz JR, Fedan KB. Spirometric Reference Values from a sample of the general U.S. Population. Am J Respir Crit Care Med 1999; 159: 179-187.
Knudsen RJ, Lebowitz MD, Holberd CJ, Burrows B. Changes in the normal maximal expiratory flow-volume curve with growth and aging. Am Rev Respir Dis 1983; 127: 725-734
Morris JF, Koski A, Temple WP, Claremont A, Thomas DR. Fifteen year interval spirometric evaluation of the Oregon predictive equations. Chest 1988; 92: 123-127
Narancic NS, Pavlovic M, Zuskin E, Milicic J, Skaric-Juric T, Barbalic M, Rudan P. New reference equations for forced spirometry in elderly persons. Respir Med 2009; 103: 621-628.

PFT Blog by Richard Johnston is licensed under a Creative Commons Attribution-NonCommercial 4.0 International License.

