Closing Volume (CV) is a measurement made from a single-breath nitrogen washout (SBNW) test. It was commonly performed decades ago and elevated values were considered to be an indication of small airways disease and an aid in the detection of the early stages of airways disease. It is hardly ever performed any more but I still occasionally see research studies that include this test and almost every test system that is capable of measuring lung volumes by nitrogen washout is also capable of performing a CV.
The CV test is performed with a test system with an analyzer tap immediately next to the mouthpiece and a way of delivering 100% oxygen either from a demand valve or a reservoir. Originally this test was performed using a real-time nitrogen analyzer but it is now almost always performed with an oxygen analyzer instead. A subject is placed on the mouthpiece and exhales to RV and then inhales 100% oxygen to TLC. The subject then exhales steadily to RV and during the exhalation the subject’s exhaled nitrogen (either real or calculated from the oxygen concentration) is plotted against their exhaled volume and produces a curve that looks like this:
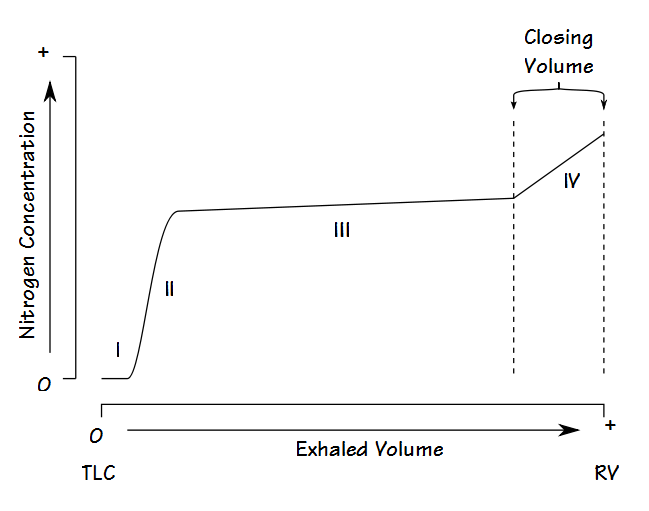
The trace is divided into four portions. Phase I is the very beginning of exhalation where only oxygen is being exhaled and consists primarily of test system and airway deadspace. Phase II is where the nitrogen concentration rises rapidly and consists of mixture of airway and alveolar gas. Phase III is where the nitrogen concentration plateaus and its slope depends on the uniform distribution of gas in the lung. Phase IV is where the nitrogen concentration rises more or less abruptly from the plateau and is considered to be part of the closing volume. The inflection point between phase III and phase IV is not always easy to discern and may need to be extrapolated from the phase III and phase IV slopes.
Closing Volume is usually expressed either as the Closing Volume/Vital Capacity ratio (CV/VC), or Closing Capacity is calculated by adding CV to RV (which is measured as part of a separate lung volume test) and this is expressed as the Closing Capacity/Total Lung Capacity ratio (CC/TLC). An additional measurement that can be obtained from this maneuver includes the slope of phase III in percent N2 per liter (%N2/L).
When an individual exhales to RV and then inhales to TLC, at the beginning of the inhalation the inhaled air preferentially goes to the apices of the lung. This initial volume of air contains machine and airway deadspace gas that contains a high concentration of nitrogen. As the inhalation continues the basal portion of the lung then receives 100% oxygen. During exhalation, the basal portion of the lung empties first and the apices last. The nitrogen concentration abruptly rises when the flow rate from the basal portion decreases and the expiratory flow comes primarily from the apices. This inflection has been considered to be a sign of airway closure.
One of the first problems to be noted with the Closing Volume test is that the measured CV increases as the expiratory flow rate increases. For this reason expiratory flow is usually maintained at 0.4 to 0.5 L/sec either by visual feedback or a flow-limiting orifice. Although an orifice tends to increase airway pressure at least one research study has indicated that this alone does not change the measured Closing Volume.
Note: The ERS/ATS statement on inert gas washout testing specifies that the inhalation to TLC should also be at 0.4 to 0.5 L/sec but the reason for this is not explained and I have found no studies on Closing Volume that address this point. Interestingly, in one population study only 42% of its participants were able to correctly perform a Closing Volume test and the primary reason for this was an inability to inhale and exhale at the correct flow rate.
When the Closing Volume test was performed on different populations it was noted that CV/VC and CC/TLC were elevated in individuals with COPD and Asthma. It was also noted that it was elevated in smokers without apparent airway obstruction. For these reasons it was considered to be a way to measure small airways disease and many PFT labs began to perform this test routinely.
Unfortunately for the early advocates later research showed that a relatively high proportion of healthy, asymptomatic non-smokers had “abnormal” results and that CV was not significantly different between individuals with symptomatic and asymptomatic lung disease. In addition the CV test has relatively poor within-individual reproducibility and this may be one of the reasons that the normal range for CV has been found to be quite large (in one study a CV/VC up to 158% of predicted was WNL). Moreover, both normal and abnormal CV results were poor at predicting whether or not an individual developed airway obstruction in the future. The sparkle left the Closing Volume test relatively quickly and by the 1990’s it was only rarely performed either clinically or for research.
The original interpretation of Closing Volume test was that it was related to the closure of airways. A relatively recent research study using a sophisticated computer model has called this into questions. The computer model indicated that the same N2 curve will occur when airflow from the basal region slows or stops regardless of whether this is due to airway closure or not. The model can’t say that airway closure doesn’t occur, only that it isn’t the only possible interpretation of the N2 curve.
One of the alternate measurements from a SBNW test is the phase III slope of N2 (%N2/L) which has been used as a measure of ventilation homogeneity. This makes a certain amount of sense and is similar to the slope of the methane tracing during the exhalation phase of a DLCO test. I’ve noticed in the past that the methane tracing tends to be horizontal in patients without airway obstruction and that when airway obstruction is present the slope of the methane tracing is roughly proportional to the degree of airway obstruction.
The ERS/ATS statement on inert gas washout tests indicates that the phase III N2 slope should be measured using linear regression. It suggests defaulting to between 25% and 75% of the exhaled volume but also suggests that this should be manually adjusted to ensure that phase II and phase IV values are excluded. In addition the statement says that analyzer noise and cardiogenic oscillations should also be excluded but has no particular guidelines for recognizing these things. The phase III N2 slope has been used in a number of research studies but primarily as a way of characterizing their study populations and not as an outcome measurement. Although the degree of ventilation inhomogeneity is a somewhat relevant finding I am hard pressed to see that it is clinically useful enough to justify performing a SBNW.
A SBNW can usually be performed on almost any test system that is capable of performing N2 washout lung volumes. The CV and phase III N2 slope provide some interesting physiologic information about how ventilation proceeds in different parts of the lung, but their clinical usefulness is small. The early enthusiasm for the Closing Volume measurement turned out to be unfounded and it is now rarely, if ever, performed.
Although the clinical relevance is questionable there may still be some value in performing CV and phase III N2 slope tests in research studies and there are reference equations for these tests for those that are interested:
Adult male:
| Reference: | Test Value: | Reference Equation: |
| [C] | CV (L): | (0.0144 x age) + (0.0027 x height) – 0.3735 |
| [A] | CV/VC (%): | 0.357 x age) + 0.562 |
| [B] | CV/VC (%): | (0.311 x age) – (0.0946 x height) + (0.114 x weight) 10.1 |
| [C] | CV/VC (%): | (0.2799 x age) – (0.0803 x height) + 15.8723 |
| [C] | CC (L): | (0.0322 x age) + (0.0248 x height) – 2.91 |
| [C] | CC/TLC (%): | (0.03518 x age) – (0.1126 x height) + 42.6671 |
| [A] | CC/TLC (%): | (0.496 x age) + 14.878 |
| [B] | %N2/L Slope | (0.00814 x age) – (0.00567 x weight) + 2.07 |
Adult female:
| Reference: | Test Value: | Reference Equation: |
| [C] | CV (L): | (0.0101 x age) + (0.0056 x height) – 0.7853 |
| [A] | CV/VC (%): | (0.293 x age) + 2.812 |
| [B] | CV/VC (%): | (0.291 x age) + (0.0761 x weight) – 2.38 |
| [C] | CV/VC (%): | (0.2734 x age) + 2.882 |
| [C] | CC (L): | (0.0303 x age) + (0.0197 x height) – 2.1137 |
| [A] | CC/TLC (%): | (0.536 x age) + 14.42 |
| [C] | CC/TLC (%): | (0.4245 x age) + 23.6487 |
| [B] | %N2/L Slope | (0.0163 x age) – (0.00742 x weight) + 0.854 |
References:
Al-Bazzaz FJ. Single-breath nitrogen washout. Chest 1979; 76(1): 83-88.
Buist AS, Ross BB. Closing volume as a simple, sensitive test for the detection of peripheral airway disease. Chest 1973; 63(4): 29S-30S.
[A] Buist AS, Ross BB. Predicted values for closing volumes using a modified single-breath nitrogen test. Am Rev Resp Dis 1973; 107: 744-752.
Buist AS. Current status of small airways disease. Chest 1984; 86(1): 100-105.
[B] Dosman JA, Cotton DJ, Graham BL, Hall DL, Froh F, Barnett GD. Sensitivity and specificity of early diagnostic tests of lung function in smokers. Chest 1981; 79(1): 8-11.
Kitaoka H, Kawase I. A novel interpretation of closing volume based on single-breath nitrogen washout interpretation. J Physiol Sci 2007; 57(6): 367-376.
Olin AC, Andelid K, Vikgren, Rosengren A, Larsson S, Bake B, Ekberg-Jansson A. Single breath N2-test and exhaled nitric oxide in men. Respiratory Medicine 2006; 100: 1013-1019.
Robinson PD et al. ERS/ATS Consensus Statement for inter gas washout measurement using multiple- and single-breath tests. Eur Respir J 2013; 41: 507-522.
Rodarte JR, Hyatt RE, Cortese DA. Influence of expiratory flow on closing capacity at low expiratory flow rates. J Appl Physiol 1975; 39(1): 60-65.
Rodarte JR, Hyatt RE, Rehder K, Marsh HM. New tests for the detection of obstructive pulmonary disease. Chest 1977; 72(6): 762-768.
Travis DM, Green M, Don H. Simultaneous comparison of helium and nitrogen expiratory “closing volumes”. J Appl Physiol 1973; 34(3): 304-308.
[C] Viegi G, Paoletti P, De Pede F, Prediletto R, Carrozzi L, Pistelli G, Giuntini. Single-breath nitrogen test in an epidemiologic survey in North Italy. Reliability, reference values and relationship with symptoms. Chest 1988; 93: 1213-1220.

PFT Blog by Richard Johnston is licensed under a Creative Commons Attribution-NonCommercial 4.0 International License
A question…. Would it be correct to say that a normal distribution of ventilation excludes any significant ventilator inhomogeneity ? Thanks.
Due to gravity if nothing else there is always a certain level of inhomogeneity in ventilation and perfusion in the lung. There may be some question about what’s normal and how it should be measured (i.e., closing volume, LCI, VA/TLC etc.) but I think by definition a normal distribution of ventilation would imply the lack of significant ventilation inhomogeneity. This gets fuzzier with some of the tests that indirectly imply ventilation inhomogeneity (like Vd/Vt) because they are dependent on the matching of ventilation and perfusion as well as the convective transport of gas in the lung.
Regards, Richard
Regarding reference equation:
%N2L Slope. I calculate my patient using formula (0.008 x age) – (0.00567 x weight) and I got negative result. Could you explain what it means.
Thank you Sir
Mangsor –
Good catch. There was a typo when I transcribed the formula and left out a constant. The corrected formula is: (0.00814 x age) – (0.00567 x weight) + 2.07 for males and (0.0163 x age) – (0.00742 x weight) + 0.854 for females. I’ve updated the posting with the corrections.
Thanks!
Regards, Richard
In the old SensorMedics system the rate of expiration in the single breath N2 washout test (Fowler’s Method?) was achieved by using a flow limiter on the expiration port.
Bruce –
That was a fairly common way to do that. Back in the 70’s we had a Collins N2 washout system that came with a set of flow restrictors. However, although performing an N2 washout at a specific expiratory flow rate helps to standardize the test, being somewhat skeptical (or is that cynical?) I’d say that any test that requires expiration to be performed at a specific flow rate across all genders, heights and ages has some open questions about what exactly is being measured.
Regards, Richard