Proposal to improve the readability of flow-volume loops

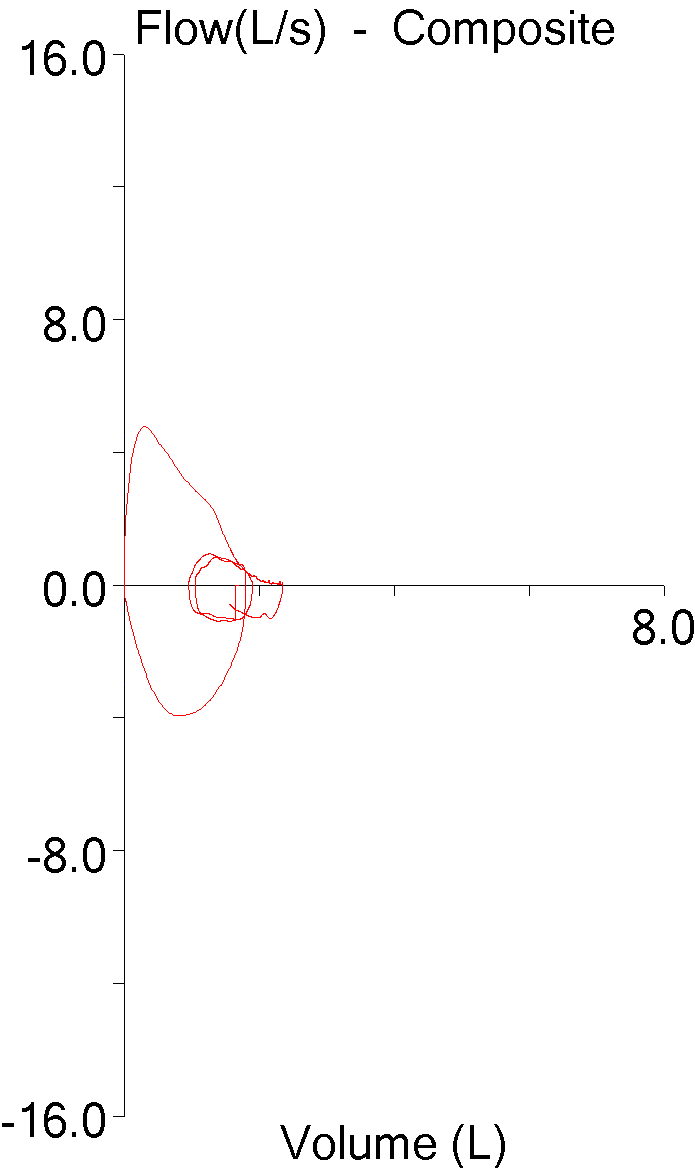
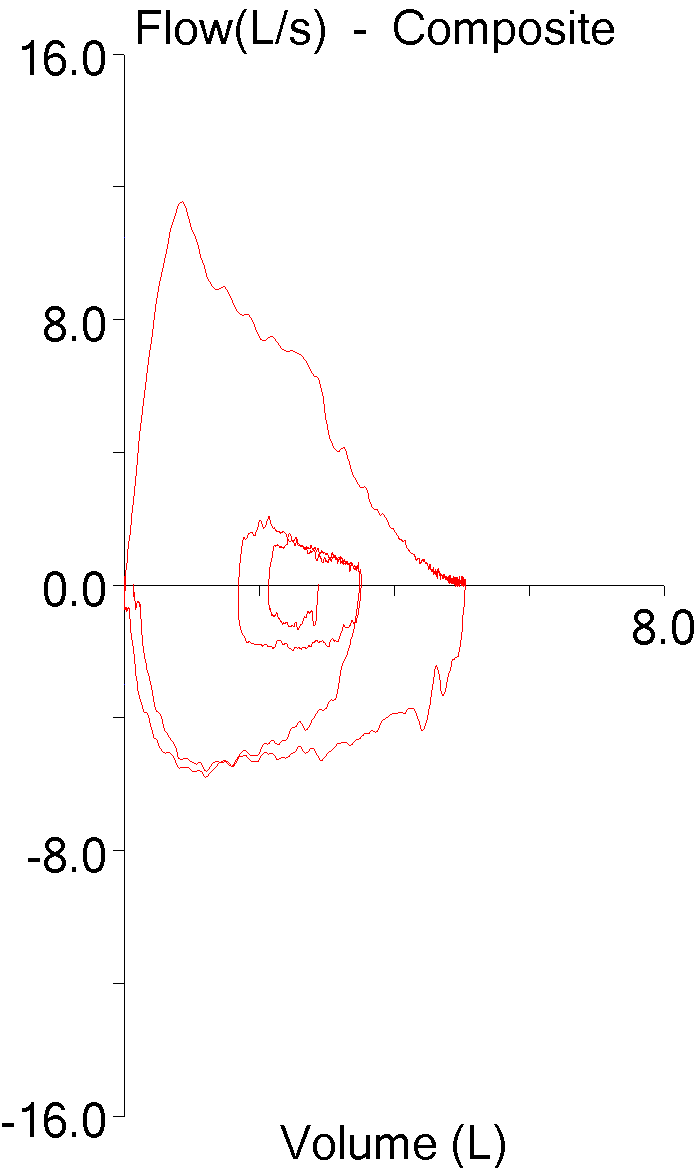
I’ve been planning on putting together a tutorial on characterizing and interpreting the contours of flow-volume loops so I’ve been accumulating flow-volume loops that are examples of different conditions. Lately I was reviewing some of them and noticed that when I tried to compare loops from different individuals with similar baseline conditions that the different sizes of the flow-volume made this difficult. For example, these two loops are both from individuals with normal spirometry.

FVL_Scaling_05

FVL_Scaling_08

One is from short, elderly female and one is from a tall, young male. If all you had to look at was the flow-volume loops, you might think that the smaller loop was abnormal, but the larger loop actually comes from a spirometry effort with an FVC that was 92% of predicted while the smaller loop’s FVC was 113% of predicted. The difference in sizes of these loops is of course due to the difference in age, gender and height between these individuals but also because of settings we’ve made in our lab software and because of the ATS/ERS spirometry standards.

Continue reading

What’s in a name?

My lab is in the final stages of a software update that will allow for electronic signing of our reports. This has been a long and slow process partly because the release date of the software got pushed back several times but mostly because a wide variety of different hospital departments and sub-departments have had to be involved.

In all the years that I’ve had computers in the pulmonary function lab I’ve never gone through a software update that was either as easy as expected or occurred within the original schedule. This includes the time when all we had was a single IBM PC/AT with a 40 megabyte hard drive, no network and the only people that cared we were going through an update was ourselves. Since we now have a dozen networked PCs located in two different building on-campus as well as three off-site locations using an IS-managed SQL server and HL7 interface I didn’t have any expectations for a speedy update and so far I have not been disappointed.

This time because the update revolves around electronic signing the hospital’s Health Information Management (HIM, i.e. Medical Records) department has been significantly involved. Among other things this has led to HIM reviewing all of our reports and requiring changes to bring them up to hospital standards. To some extent this make sense since, for example, they require that patient identification be exactly the same on all reports from all departments (same fields, same locations).

However, they also questioned some of the terminology used on our test reports. We’ve used the default test names that were in our report format editor (yes, we’re that lazy) and until they were brought to our attention I never really thought how odd some of them were. In particular, some of the terms used for the diffusing capacity didn’t make a lot of sense. For example, DLCO corrected for hemoglobin was DsbHb and DLCO/VA was reported as D/Vasbhb. To some extent I understand where these names came from but the reality is that they are in part holdovers from the past, in part they come from a need to keep names short so they fit in what space is usually available on reports, and in some cases they were probably created by programmers who hadn’t the slightest idea what the correct nomenclature should have been.

Note: Dsb likely comes from a time when you needed to differentiate between the results of different types of DLCO tests (steady-state and single-breath). Since there hasn’t been a test system built for at least 40 years that could perform a steady-state DLCO, the need to make this distinction is long since past.

Continue reading

Static reports, dynamic world

Reports are how patient test results are distributed. Paper versions have become less common because reports are now stored electronically in hospital information systems. Even if the way in which a report’s image is now stored, retrieved and distributed has changed, reports are still generated by our lab’s software systems and the ways in which this is done have not changed in any significant way for quite a while.

Reports are the public face of any pulmonary function lab and they should be designed to be readable and pertinent. It is critically important for any lab to create and manage reports correctly. So why does our lab software make it so hard to do this?

Over the last several months I’ve had the opportunity to compare the reporting systems of the three largest manufacturers of pulmonary function equipment in the US. There are differences of course between each reporting system since each has its own approach towards formatting, editing and printing reports. What they all share however, is a similar underlying model for reports that I call static report pages.

What I mean by static is that the report elements and their position on a report page are determined and fixed in place when the report is formatted. When the report is printed, regardless of whether the results are present or not, the report page does not change. This means that if you format a report to contain spirometry, lung volumes and DLCO, and the only test you perform is spirometry, when you print the report the sections for lung volumes and DLCO will contain no results but they will still appear.

The number of tests that need to be placed on a report will vary from lab to lab depending on what equipment they are equipped with. For example, these tests are available on one manufacturer or another’s test systems:

Spirometry

Lung Volumes – Plethysmography

Lung Volumes – N2 Washout

Lung Volumes – Helium Dilution

Diffusing Capacity

RAW/SGaw

MIP/MEP

MVV

SBN2

6MWT

FOT/IOS

There are probably other tests as well but even if there aren’t, there are other report elements such as demographics, text notes, flow-volume loops, trends etc. that also need to be managed.

Continue reading

Seeing shouldn’t always be believing

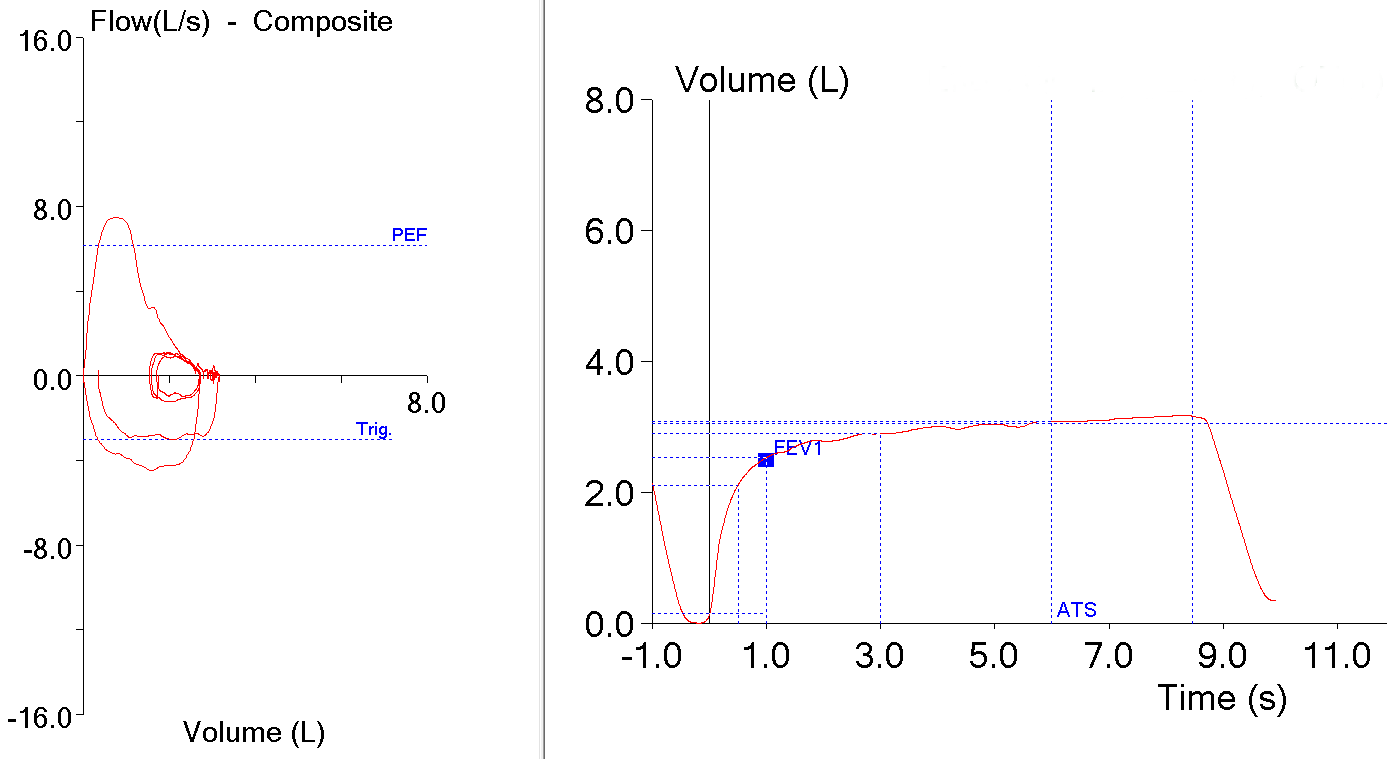
Although the numerical results are of course important, visual inspection of the volume-time and flow-volume loop graphs from a spirometry test are a critical part of interpretation. Spirometry quality and performance issues that don’t show up in the numbers are often highly evident in the graphs. Choices we make in creating and configuring reports however, can hide important visual details and have the potential to decrease interpretation quality.

Recently I was inspecting the results for a spirometry test. There wasn’t anything particularly unusual about the numbers or the graphics on the report, I just like to make spot-checks on spirometry quality and wanted to make sure the best results had been selected. When I pulled up the raw test date on my computer screen I noticed an unusual wavering pattern in the volume-time curve. I don’t remember seeing a volume-time curve like this before and when I checked all of the patient’s efforts were similar and all showed similar oscillations.

VT_Curve_waver_redacted

Continue reading

LOINC, and why it matters to your HIS Interface

The Hospital Information Systems (HIS) at different medical centers have grown up mostly in isolation from each other. Even when an HIS is installed by a national vendor, each individual hospital has tended to make its own customizations and to follow past conventions. This is changing and it is changing because there are a number of issues driving rapid improvements in inter-hospital communication. The Meaningful Use (MU) Act is major factor and one that has been helping to set the pace, but because improved communication lowers costs and improves the quality of care insurers and medical institutions have been moving in this direction for their own reasons as well.

The regulations and standards for Health Information Exchange (HIE) are evolving rapidly. The overall framework for HIE resides in the Consolidated Clinical Data Architecture (C-CDA) and HL7 messaging protocols. This has given hospitals a unified approach towards managing their communication channels between physicians, clinics, other hospitals and insurers but one problem limiting the usefulness of this has been the different nomenclature used by different institutions for the same pieces of information.

When databases are grown in isolation they tend to end up with labels for data elements that are idiosyncratic and unique to each medical center. There needs to be a way to resolve this Tower of Babel and that is what the Logical Observation Identifiers Names and Codes (LOINC) organization is doing.

Continue reading

Using an HIS Interface as your report manager

The last several decades has seen a complete transition to the use of computers in pulmonary function testing. This has improved Lab efficiency, but it is also the new baseline. Further improvements in technology may improve the reliability and accuracy of test equipment and test results, but it is unlikely to improve PFT Lab efficiency any more than it already has.

Report management, which is really information management, has started but hasn’t yet completed the same technological transition and it is here that significant improvements can still be made. These improvement will not only improve the efficiency of the pulmonary function lab, but also its clinical effectiveness for the physicians and patients that are the lab’s customers.

To one degree or another most pulmonary function labs are still dominated by traditional reporting systems which are labor intensive and slow. Managing paper reports for a patient visit usually consists of:

  • Patient reports are kept in folders and either a new folder needs to be created or the patient’s existing folders need to be pulled from file cabinets.
  • Printing the test results and then collating the reports with patient’s lab folder.
  • Delivering a stack of reports and lab folders to a reviewer who makes penciled notes on the reports.
  • The stack of reports and lab folders is transferred to a typist who types the interpretation into the lab database.
  • The final reports are printed, collated with the patient lab folders and stack of lab folders and reports are delivered to the physician who then physically signs each report.
  • Reports are photocopied and snail-mailed to the ordering physician and medical records.
  • The lab folders are re-filed.

Not every pulmonary function lab still uses all of these steps to manage reports of course, but large parts of this overall process are often still major components in report management. So why are we still moving paper around when what we really want to do is to move the information that’s on the paper around?

Continue reading

Marketing your PFT Lab

A writer posed an interesting question on the AARC Diagnostics forum several weeks ago and that was how to market their PFT Lab. I don’t think they got much of a response but I have been thinking about this since then.

I think that any good lab manager wants to see their lab succeed and grow. I’ve always felt that pulmonary function testing is an essential component of preventive care but that despite this PFT Labs are underutilized. In order to market your PFT Lab effectively you need to understand your customers and target your message accordingly. You also need to understand that you can’t get something for nothing. Marketing requires that you expend resources, whether it is just your time or includes lab budget money, in order to get any payback.

There are three target audiences for your marketing; patients, physicians and administrators. Each audience has a different question you must be able to answer. For patients the question is going to be “why do I need pulmonary function testing?”. For physicians it is going to be “why should I send my patients to your lab?” and for administrators it is “why should I devote resources to your lab?”.

Continue reading

The difficulties in reporting multiple spirometry post efforts.

It’s always fascinating how a simple problem can blossom into something much more complicated. Ninety-five percent of the time when we need to report post test results for spirometry they are for post-bronchodilator. The remaining times they are for supine or post-exercise spirometry. At least once or twice a month however, we need to report two post results, not just one and this is where we run into problems.

The most common scenario for this is when we need to report a baseline result and then both a post-exercise result and then a post-bronchodilator result. We need to do this when a patient bronchospasms during or following an exercise test and we find need to give them a bronchodilator after performing the post-exercise spirometry. Less commonly we are occasionally requested to perform both supine and post-bronchodilator spirometry as part of the same visit. Whenever either of these situations occurs we need to perform a number of work-arounds that end up taking extra time and effort.

Continue reading

It’s after midnight, do you know where your reports are?

After the tests themselves, the second most important thing that a Pulmonary Function Lab needs to do is to report results. Like a tree falling in the woods, if a report hasn’t gotten in front of the person that ordered the tests, has anything happened? A successful PFT Lab needs to manage its reports effectively.

An obstacle that many labs will need to overcome is the reporting software that comes with their testing systems. I think that for many of the PFT equipment manufacturers reports are an afterthought at best. The ability to format reports to a specific lab’s needs is often limited and is just as often is a difficult and time-consuming process.

For example my lab maintains approximately eight different report formats, each tailored to the most common mix of tests we perform. If we need to change an item in patient demographics (and we have) then that means that this change needs to be made separately in each of the eight different formats. If this change requires more space on the report and that other report elements need to be moved to accommodate this, then this has to be done on each of the report formats as well. The software has no ability to copy or share changes between report formats (which I am sorry to say is ridiculous since I remember having reporting software in the DOS era where this was possible).

Continue reading