Selecting the best FEV1. What role should PEF play?

Recently my lab has had some turnover with a couple of older staff leaving and new staff coming on board. While reviewing reports I’ve found a number of instances where the incorrect FVC and FEV1 were reported. Taking these as “teachable moments” I’ve been annoying the staff with emails whenever I find something notably wrong. I had thought that our rules for selecting the best FVC and FEV1 were fairly straightforward but given the number of corrections I’ve made lately it seemed like it would be a good idea to revisit our policy on this subject.

The process I’ve used for selecting the best FVC and FEV1 has evolved over the years. Initially I was told to select the single spirometry effort that had the largest combined FVC and FEV1. Later on test quality became a factor (not that is wasn’t in the beginning but there aren’t a lot of quality indicators for a pen trace on kymograph paper). How to juggle the different quality rules wasn’t altogether clear however (they seemed to change a bit with whichever physician was reviewing PFTs at the time), and I was still supposed to somehow select just a single spirometry effort.

Most recently this was simplified by only having to select the largest FVC (regardless of test quality) from any spirometry effort and then the largest FEV1 as long as it came from a spirometry effort with good quality. This is pretty much in accord with the ATS/ERS spirometry standards but with one important difference, and that is that we use use Peak Expiratory Flow (PEF) as an indicator of test quality.

Strictly speaking the ATS/ERS standards state that

“The largest FVC and the largest FEV1 (BTPS) should be recorded after examining the data from all of the usable curves, even if they do not come from the same curve.”

There are, of course, a number of quality indicators for spirometry efforts that are used to indicate whether a curve is “usable”. These include things like back-extrapolation, expiratory time, terminal expiratory flow rate and repeatability but the one thing they do not include is PEF.

Despite not being within the ATS/ERS standards the reason that we use PEF in the selection process is found in the phrase “maximal forced effort” that is part of the ATS/ERS definition for FVC and FEV1. It has long been recognized (certainly since the early 1980’s and most likely earlier) that the FVC and FEV1 from a submaximal spirometry effort were often higher than the FVC and FEV1 from a maximal effort. So, is the largest FEV1 correct (as long as it meets the basic ATS/ERS criteria) or should it be the FEV1 from the effort with the highest PEF?

These two efforts from the same patient testing session highlight this dilemma. Both meet the ATS/ERS criteria for the start of the test which is what primarily applies to FEV1 (and PEF).
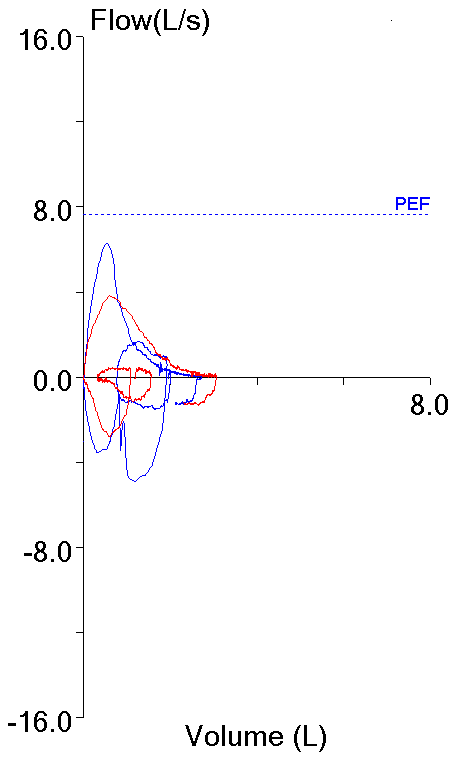
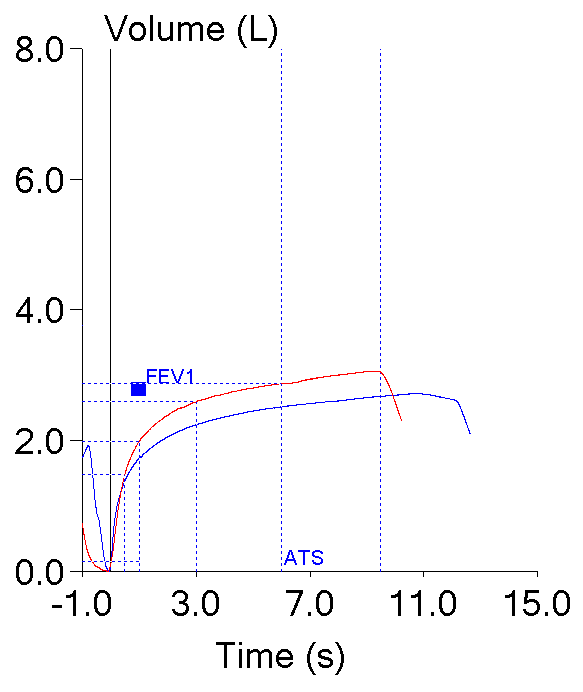
FEV1_vs_PEF_FVL

FEV1_vs_PEF_V-T

Blue: Red:
FVC (L): 2.72 3.06
FEV1 (L): 1.73 1.99
PEF (L/sec): 6.28 3.82

Continue reading

COPD and the FEV1/FVC ratio. GOLD or LLN?

Everyone uses the FEV1/FVC ratio as the primary factor in determining the presence or absence of airway obstruction but there are differences of opinion about what value of FEV1/FVC should be used for this purpose. Currently there are two main schools of thought; those that advocate the use the GOLD fixed 70% ratio and those that instead advocate the use the lower limit of normal (LLN) for the FEV1/FVC ratio.

The Global Initiative for Chronic Obstructive Lung Disease (GOLD) has stated that a post-bronchodilator FEV1/FVC ratio less than 70% should be used to indicate the presence of airway obstruction and this is applied to individuals of all ages, genders, heights and ethnicities. The official GOLD protocol was first released in the early 2000’s and was initially (although not currently) seconded by both the ATS and ERS. The choice of 70% is partly happenstance since it was one of two fixed FEV1/FVC ratio thresholds in common use at the time (the other was 75%) and partly arbitrary (after all why not 69% or 71% or ??).

The limitations of using a fixed 70% ratio were recognized relatively early. In particular it has long been noted that the FEV1/FVC ratio declines normally with increasing age and is also inversely proportional to height. For these reasons the 70% threshold tends to over-diagnose COPD in the tall and elderly and under-diagnose airway obstruction in the short and young. Opponents of the GOLD protocol say that the age-adjusted (and sometimes height-adjusted) LLN for the FEV1/FVC ratio overcomes these obstacles.

Proponents of the GOLD protocol acknowledge the limitation of the 70% ratio when it is applied to individuals of different ages but state that the use of a simple ratio that is easy to remember means that more individuals are assessed for COPD than would be otherwise. They point to other physiological threshold values (such as for blood pressure or blood sugar levels) that are also understood to have limitations, yet remain in widespread use. They also state that it makes it easier to compare results and prevalence statistics from different studies. In addition at least two studies have shown that there is a higher mortality of all individuals with an FEV1/FVC ratio below 70% regardless of whether or not they were below the FEV1/FVC LLN. Another study noted that in a large study population individuals with an FEV1/FVC ratio below 70% but above the LLN had a greater degree of emphysema and more gas trapping (as measured by CT scan), and more follow-up exacerbations than those below the LLN but above the 70% threshold.

Since many of the LLN versus GOLD arguments are based on statistics it would be useful to look at the predicted FEV1/FVC ratios in order to get a sense of how much under- and over-estimation occurs with the 70% ratio. For this reason I graphed the predicted FEV1/FVC ratio from 54 different reference equations for both genders and a variety of ethnicities. Since a number of PFT textbooks have stated that the FEV1/FVC ratio is relatively well preserved across different populations what I initially expected to see was a clustering of the predicted values. What I saw instead was an exceptionally broad spread of values.

Male_175cm_Predicted

[more] Continue reading

RVD’s and OVD’s can’t mix without the FEV1/FVC ratio

The patients whose reports I review have always been very accommodating. An issue of one kind or another catches my attention and before I know it I find several more reports that are similarly involved. Thanks to our patients I’ve had a number of reports come across my desk recently that showed a combination of restrictive and obstructive defects. This particular one may not be the best possible example but it seems to illustrate several points fairly well.

Observed: %Predicted: Predicted:
FVC (L): 1.12 40% 2.80
FEV1 (L): 0.75 35% 2.16
FEV1/FVC (%): 67 86% 78
TLC (L): 1.92 42% 4.54
FRC (L): 1.18 48% 2.47
RV (L): 0.76 44% 1.73
RV/TLC (%): 40 104% 38

Interpreting results like this as combined (or mixed) defects using the ATS/ERS algorithm seems relatively straightforward.

ATS-ERS Algorithm 2

From Brusasco V, Crapo R, Viegi G. ATS/ERS Task Force: Standardisation of pulmonary function testing. Interpretive strategies for lung function tests. Eur Respir J 2005; 26, page 956

The algorithm starts by using the FEV1/FVC ratio to determine whether obstruction is present and only then considers whether or not the FVC and TLC are normal. It occurred to me however, that this assumes that the normal range of the FEV1/FVC ratio is preserved when TLC decreases below normal. Given the markedly different causes of restrictive lung disease it would seem that saying that the FEV1/FVC ratio should remain within the normal range over a relatively broad range of lung capacities (and without necessarily knowing the cause for any reduction) seems a bit far-fetched. Interestingly enough however, it actually turns out to be reasonably true.

Continue reading

The 8 Percent Solution

The current ATS/ERS standards for a positive bronchodilator response are an increase in FEV1 or FVC of ≥ 12% and ≥ 200 ml. These standards are largely based on the ability to detect a change that is far enough above the normal variability in FEV1 and FVC to be considered significant. One problem with this is that the amount of variability that is considered to be “normal” is overly influenced by a relatively small number of subjects that have a high degree of variability.

At least one group of investigators has suggested that a way around this is to subject all of an individual’s pre- and post-bronchodilator spirometry to statistical analysis in order to determine their coefficient of variability. Once this is known, the pre- and post-bronchodilator efforts can be assessed as a group to determine whether whether there has been a statistically significant change. Using this approach they were able to show that a rather large number of subjects that did not meet the ATS/ERS criteria did have a statistically significant improvement in FEV1.

But an increase that is statistically significant or one that is greater than normal variability is not the same thing as clinical significance. Numerous investigators have noted that patient can have a post-bronchodilator clinical improvement as shown by a decrease in dyspnea or an increase in exercise capacity without any notable change in FEV1 or FVC. Clinical significance is hard to measure however, particularly since which criteria should be used to measure it are unclear.

Long-term survival is certainly clinically significant and a recent article in Chest (Ward et al) has linked the increase in post-bronchodilator FEV1 to this fact. What these investigators have been able to show was that individuals with a post-bronchodilator increase in FEV1 that was 8% of predicted or greater showed a significantly better long-term survival than individuals with a smaller increase.

Continue reading

Assessing FEV1 trends, re-visited

There are a couple of different ways to assess changes in FEV1 from one patient visit to another. For several decades my lab has used a change of >=10% and >=200 ml as the threshold for a significant change. Recently the ATS released standards for occupational spirometry that included an age-adjusted change in FEV1 of >=15% as the threshold for significant change. For the time being we have continued to use the 10% threshold when comparing results that are relatively close in time and are using the 15% threshold when they are separated by a much longer period. Since we haven’t actually gotten around to defining what is recent and what isn’t there is still a bit of uncertainty in how we apply this but even though there are differences in thresholds and how the numbers are calculated both approaches are essentially numerical. Recently a couple of reports crossed my desk that have caused me to wonder whether a qualitative change should also be a consideration.

Trend Table 1

In the 14 years between these two tests the FEV1 has decreased by 0.56 L or -12.6%. By the 10% threshold criteria this is a significant change but I think that 14 years is a reasonably long period of time and the age-adjusted change is only 5.1% which indicates this change is not significant.

Trend Table 2

In the year between these two tests the FEV1 has decreased by 0.22 L or 7.0%, which doesn’t meet either criteria for a significant change.

But what has changed between these tests is that in both instances the spirometry went from normal to showing mild obstruction. This is a qualitative change and I think it is likely significant.

Continue reading

What’s normal about FEV1 and how much does ethnicity matter?

When it comes to spirometry, it’s really all about FEV1. FVC and the FEV1/FVC ratio are also important of course, but because FVC is more likely to be underestimated than FEV1 they are less reliable.

Changes in FEV1 are critical in monitoring airway disease. The recent ATS guidelines on Occupational Spirometry indicate that a 15% decrease (adjusted for changes in age) is significant and cause for concern. For diagnosing airways disease however, it is important to know what a normal FEV1 is.

I have been able to find twenty-four different reference equations for FEV1. That’s good in one sense but that quantity also makes it that much more difficult to determine which reference equations should be used. When I graph results it often becomes more apparent what the equations are trying to tell us but in this case I came away a bit more confused instead.

Female FEV1 165 cm non-clustered

Male FEV1 175 cm Age non clustered

Continue reading

It’s all about FEV1, except when it isn’t.

A number of physicians and researchers I’ve known and respected have said that in spirometry it always comes down to FEV1 since it is the primary indicator for airway obstruction. Certainly FVC and the FEV1/FVC ratio are important but because patients can stop exhaling early for any number of reasons FVC can be underestimated which in turn can cause the FEV1/FVC ratio to be overestimated so they are not quite as reliable as FEV1.

There are, of course, a number of factors that can cause FEV1 to be mis-estimated. It can be underestimated due to cough or glottal closure and it can be overestimated because of excessive back-extrapolation. Nevertheless, I think that overall the FEV1 tends to be the most accurate and reliable number obtained from spirometry.

This spirometry report came across my desk this morning: 

  Observed: % Predicted: Predicted:
FVC (L): 5.01 114% 4.39
FEV1 (L): 3.86 117% 3.30
FEV1/FVC: 77 103% 75
PEF (L/sec): 4.91 55% 8.99 

Because a reduced FEV1 is a reliable indicator of airway obstruction doesn’t that mean that a normal or as in this particular case, a slightly elevated FEV1 rules it out? Well, actually no, it doesn’t.

Continue reading

Height and the GLFI FVC, FEV1 and FEV1/FVC ratio

Although the authors of the Global Lung Function Initiative (GLFI) study acknowledge the effect of height on their reference equations the range and distribution of heights in its study populations was not included in the report. This was a similar problem for the NHANESIII reference equations since the height range was never reported within the text of the original report however it did include scatter graphs showing the range of heights. These graphs imply the height range was 162 to 194 cm (64” to 76”) for caucasian males and 145 to 180 cm (57” to 71”) for caucasian females. Using the extremes of these height ranges it is interesting to see how the GLFI reference equations compare to the NHANESIII reference equations.

Continue reading

GLFI and the FVC, FEV1 and FEV1/FVC Ratio

The Global Lung Function Initiative (GLFI) was established by the European Respiratory Society in 2008 with the goal of establishing a truly worldwide set of reference equations for spirometry. Its results were released in the December 2012 issue of the European Respiratory Journal. Although the reference equations presently apply only to Caucasians, African-Americans and northern and southern Asians, it will likely be updated with Hispanic, African and Polynesian data within the next couple of years.

This has been a massive undertaking involving spirometry data from 72 different testing centers in 33 countries. The data has been subjected to rigorous quality control and an extensive, sophisticated statistical analysis and will likely become the standard reference equation set for spirometry testing in Pulmonary Function labs around the world.

Continue reading

The origin of FEV1 and the FEV1/FVC ratio

Over forty years ago when I started to learn about pulmonary function testing I was taught about the nuts and bolts of the tests, not where the tests came from or how they came into existence. Spirometry and the FVC, FEV1 and FEV1/FVC ratio have always appeared to be the core elements of pulmonary function testing and seemed most likely to have been scratched on the wall of the first paleolithic PFT lab cave. I have been reviewing a lot of older research papers lately, including several historical reviews, and was quite surprised to find out how recent both FEV1 and the FEV1/FVC ratio really are.

The first version of the modern spirometer (a counter-weighted volume displacement water seal spirometer) was developed by John Hutchinson in England around 1844. He performed vital capacity measurements on over 3000 people and in 1846 published a paper where he showed (among other things) the linear relationship of vital capacity to height. Different versions of Hutchinson’s spirometer were developed by other researchers in the following decades but even through the 1920’s the only measurement that was ever made with a spirometer remained just the vital capacity.

Continue reading