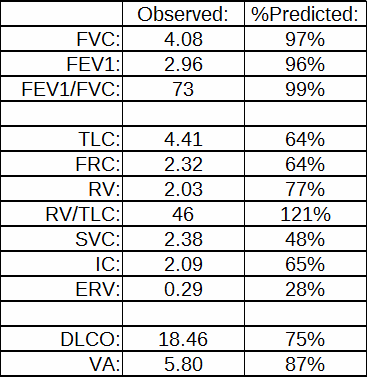
I was reviewing reports today when I ran across one with some glaring errors. There were several things that immediately told me that the reported plethysmographic lung volumes were way off; the VA from the DLCO was almost a liter and a half larger than the TLC and the SVC was only about half the volume of the FVC.
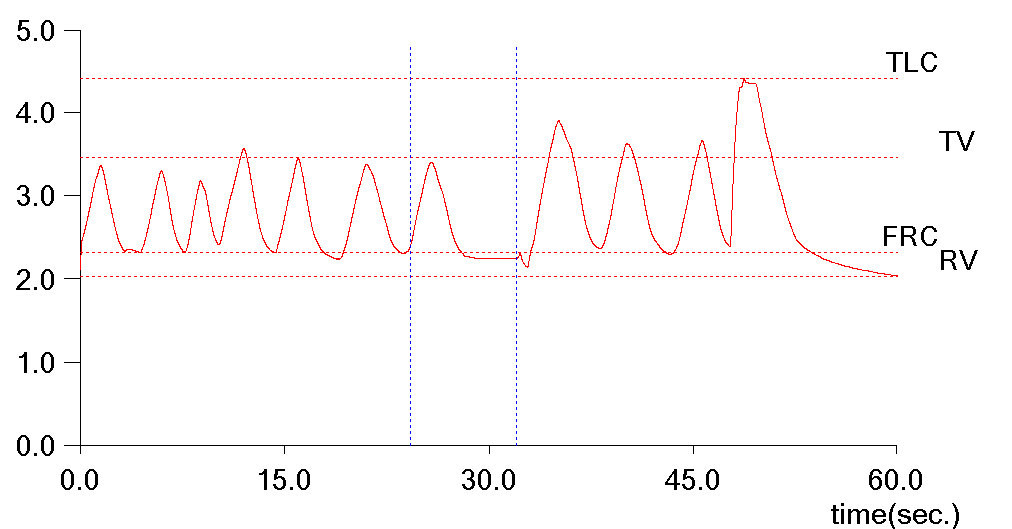
When I took a look at the raw test data I saw at least part of the reason why the technician had selected these results to be reported and that was because the SVC quality from most of the efforts was poor. They mostly looked like this:
It is apparent that the patient leaked while panting against the closed shutter and this caused the FRC baseline to shift upwards. I’ve discussed this problem previously, but when this happens the RV is larger than the FRC, there is a negative ERV and the TLC is overestimated. There is no way to fix this problem from within the software. The FRC is determined by the tidal breathing before the shutter closes and cannot be re-measured afterward.
For this reason the technician had selected the only effort that had no leak and a reasonably clean SVC maneuver.
The problem with this is that the SVC volume was also the smallest of all of the efforts and substantially less than the FVC so although the SVC quality was better in one sense, the overall quality of the lung volume measurement was still quite poor. Strictly speaking at this point the technician should either had the patient perform a couple more SVC maneuvers and combined them with the existing FRC measurements, or should have just deleted the results and not reported them at all. Neither of these things were done however, so I needed to try to fix them.
The good news was that the FRC measurements from all of the patient’s plethysmography efforts were almost exactly the same (less than 5% difference) so I knew I had a good quality FRC to work with. Even excluding the baseline shifts however, the largest of the SVC measurements was still substantially less than the FVC so none of them were salvageable. I could use the FVC in place of the SVC but in order to derive TLC and RV I needed an IC or an ERV. These volumes aren’t measured during an FVC, but the tidal breathing that occurs before the actual FVC maneuver is stored and displayed. Fortunately, our software lets me download the numerical data that generates the flow-volume loop (paired volume and flow data points at 200 samples per second) into a spreadsheet. From the spreadsheet I was able to isolate the volume of the end-exhalation tidal breath (FRC) and use this to determine both the IC and ERV.
Even if I wasn’t able to download the raw test data in this way, I could still have gotten a reasonably accurate IC and ERV from the FVL graph itself. Every graphic program I use shows the X and Y coordinates of the cursor. By placing the cursor on the left and right ends of the volume scale and measuring the difference in the x-coordinates it’s possible to determine how many pixels there are per liter.
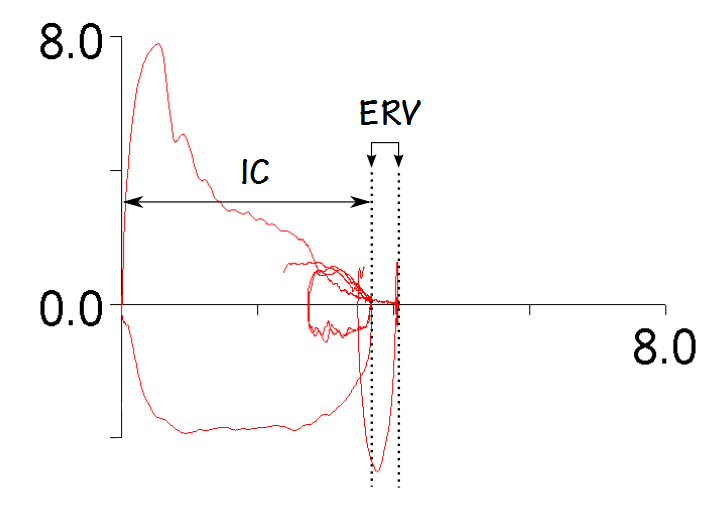
By placing the cursor on the end-exhalation (FRC) side of the tidal loop it’s also possible to measure how many pixels there are from there to the zero marker. After that, dividing by the number of pixels per liter gives the IC. This isn’t as accurate as being able to use the actual numerical data but all of the FVL graphs I work with have at least 50 pixels per liter and that means that the error can’t be more than 0.02 L (not perfect of course, but still better than reporting grossly incorrect results).
The IC I retrieved from the FVC test data was 3.66 L. I averaged the FRCs from the plethysmographic efforts with the best quality loops and got 2.21 L. Since:
TLC = IC + FRC
That meant that the TLC had to be 5.87 L. And since:
RV = TLC – VC
and
ERV = FRC – RV
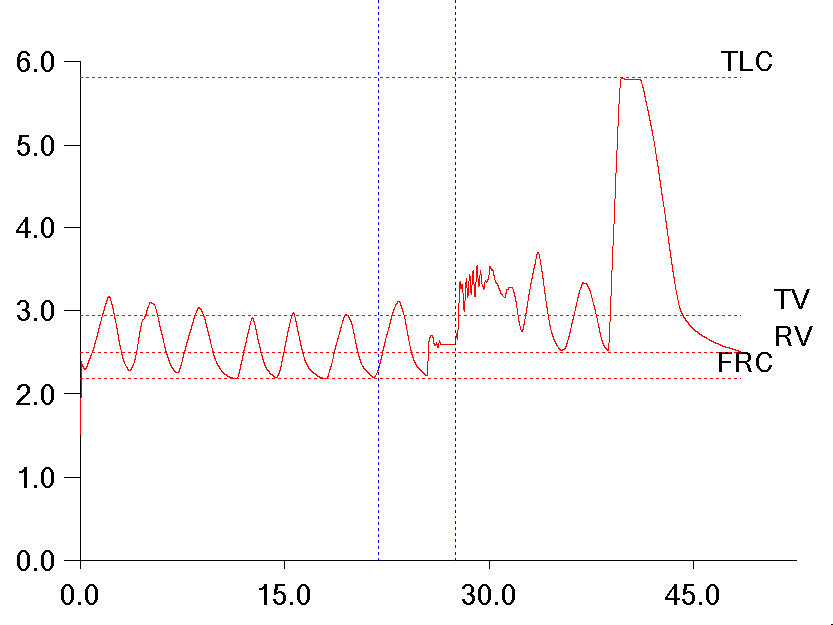
That meant the RV was 1.79 L and the ERV was 0.42 L. I created a new plethysmographic lung volume record by manually entering these results and now the lung volumes on the patient’s report looked like this:
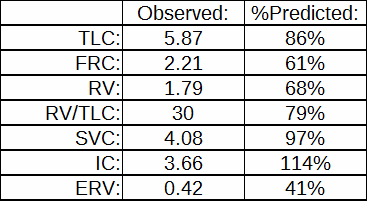
It is still possible that the patient’s TLC is underestimated, but most importantly the report now showed that the TLC was within normal limits which is at least reasonably correct rather than showing a mild to moderate restrictive ventilatory defect, which was most definitely not correct at all.
This is not the first time I’ve done this. I don’t do it all that often because these kind of errors are usually small enough not to make a significant difference in the reported results but at the same time I have no particular hesitation about manually correcting a report when I know the way in which the software derived the results wasn’t correct. I am concerned however, that I have never been able to get our technicians to make these kinds of fixes on their own. Having said that, this is probably not a fair criticism because even after I’ve given detailed explanations on what I’ve done to fix reports and why I’ve done it this is still probably seen as a supervisory-level problem and beyond their level of expertise. To some extent I understand this since there really isn’t a straightforward way to fix these kind of errors and it requires a good understanding of the software to know what approach needs to be taken in each case.
We spend a fair amount of time training technicians on testing quality and I also annoy them reasonably often with emails when I find an error (it’s not a problem, it’s an educational opportunity!) but even so I think there is an attitude that if the computer says that’s what it is, then that’s what it is. This is an endemic problem in our field (and to be fair, others as well) and it’s not isolated to just technicians. I’ve had (pulmonary!) physicians show me reports with significant mathematical and testing errors that came with their patients from other labs and then ask why my lab isn’t giving them the same results.
What I don’t see as much as I’d like is an appreciation for how the different pieces of a PFT report fit together. I am glad that our technicians can usually recognize suboptimal test quality when they see it but I would be happier if it was also realized how a low SVC affects the TLC and the RV.
I have similar criticisms for our lab software. It seems that at least a couple times a week we have patients who are able to perform a good FVC maneuver but for whatever reason never seem to be able to perform an SVC that is anywhere near as good. Although the FVC is assessed for a number of ATS/ERS quality indicators there isn’t a similar process of any kind for the SVC. Admittedly, the differences between SVC and FVC are usually small and don’t make a significant difference in the TLC and RV, but it’s not possible to assess this within any of the lung volume test modules. The only way we can compare the FVC and SVC is on a report and if there is a serious discrepancy there’s no easy way to correct it.
This report was a real fixer-upper. Like all fixer-uppers it took a bit of effort to find and fix the errors, but the end result made it worthwhile. I know that IC and ERV are not supposed to be measured as part of an FVC maneuver and I also understand the reasoning for this, but despite the “forced” part, an FVC and an SVC are much the same. When an SVC is too flawed to use then there is no reason not to “borrow” information from an FVC.
The software for every test system has its own quirks but one way or another it should be possible find and correct errors before a report is finalized (even if only in the testing notes). We should all remember that computers are only tools, patients are only human and testing systems can get whonky despite our best efforts to the contrary. A report is not etched in stone and there are numerous ways to cross-reference test results and verify their integrity. If you don’t look for problems you’ll never find them, and if you don’t find (and fix!) problems then you aren’t doing your patients, your physicians or your lab any favors.

PFT Blog by Richard Johnston is licensed under a Creative Commons Attribution-NonCommercial 4.0 International License