Almost all pulmonary function test systems seem to come with a module that can perform a computerized interpretation of PFT results. Their accuracy has been studied occasionally, often by the developers of a particular algorithm and just as often a rosy picture is painted. Given their limited (and likely pre-cleaned) data sets I am sure this is accurate as far as it goes. I have done my own admittedly very unscientific comparison and would say that for two-thirds of the patients tested the results are probably okay. The other third? Varying degrees of not so much.
This concerns me because the very locations that could use the expert assistance of computerized interpretation, small clinics and doctor’s offices where inexperienced and under-trained staff are usually tasked to perform the tests and where this would be most useful, cannot rely on it. This fact was highlighted in a recent report in the European Respiratory Journal which showed that computerized interpretation did not improve the quality of care in general practitioners offices.
Computerized interpretation of pulmonary function tests have been around for at least 40 years. At one time or another developers have used expert systems, branching logic, fuzzy logic and neural networks. Algorithms have been tweaked and updated as our understanding of pulmonary function testing has improved but none are essentially any better or more accurate now than in the 1970’s.
Why haven’t they gotten better? I think there are at least two important reasons why they haven’t and until these are addressed the quality of computerized interpretation will not improve.
First, interpretation algorithms proceed with the assumption that the test results are accurate and little or no thought has been given to the importance of assessing the quality of real-world test results. I am sure that all us who have performed pulmonary function testing realize that despite our best efforts to coach patients effectively test results are often less than perfect. Hesitation, early termination, leaks, inability to follow directions and just plain submaximal effort on the part of the patient are all too common.
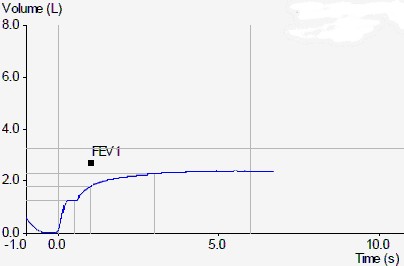
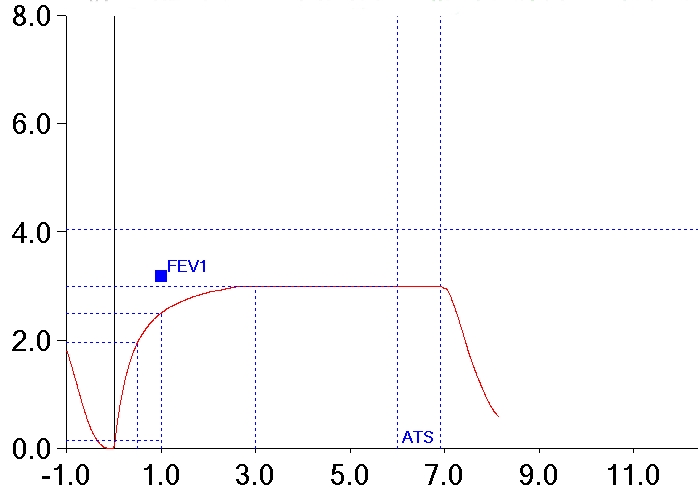
Here are two examples of spirometry efforts we have all probably seen more than once or twice that any interpretation algorithm is likely to mis-interpret.
The first effort has a hesitation within the first second of exhalation that causes FEV1 to be underestimated. The second has an early termination of exhalation that is held for a prolonged period which causes FVC to be underestimated. The test systems these results came from indicated that they met all ATS/ERS criteria for back-extrapolation, length of test and end-of-test flow rates. Computer algorithms look only at the numbers and by the numbers these two efforts appear to be acceptable but in both cases the numbers are misleading.
When reviewing test results the first step should be to look at the quality of the test. The reported FVC, FEV1, TLC and DLCO values are always provisional until this is done. Teaching a computer system to recognize when these values are under- or over-estimated is a lot more difficult than teaching it an interpretation algorithm however, and this is because both patients and test systems can be incredibly ingenious when it comes creating errors. Nevertheless, common quality issues in tests can and should be recognized.
One possible approach would be to assign a confidence factor to each test result. As different searches for errors are made, the confidence factor for specific values can be raised or lowered as appropriate. When a final analysis is made the interpretation algorithm can take then take into consideration how accurate or how under or overestimated a test value may be. This in itself would likely lead to more reasonable interpretations and when the uncertainty is great enough the algorithm would also be able say “although results suggest X, because Y is {under/over} estimated due to Z, this may not be the case”. It is better that the uncertainty is clear when the results themselves are uncertain rather than reporting a diagnosis simply because it fits the numbers.
Second, interpretation algorithms tend to focus solely on the results from a single testing session. This is unfortunate because prior test results can significantly alter how the current test results should be viewed.
As one example, a certain number of patients with asthma routinely have spirometry results that show a symmetrically reduced FVC and FEV1 with a relatively normal peak flow. When looked at in isolation this pattern suggests restriction. However since these patients may have either had prior lung volume measurements that were normal or have had prior studies that showed a significant increase in FVC and FEV1 post-bronchodilator, this would show it is not restriction but obstruction with gas trapping.
Comparison of prior results can also be an alert to testing errors. For most patients TLC does not change significantly from visit to visit so a sudden dramatic change in TLC, particularly when spirometry or diffusion capacity values don’t change, is a red flag on test quality either in the current visit or the prior visit. Dramatic changes in spirometry or DLCO values could be considered to be more likely depending on the underlying disease state but should also raise some kind of a red flag.
Strictly speaking commenting on PFT trends pre se may not be considered to be part of a computerized interpretation but unless edited and amended manually these comments will not become part of the interpretation. Creating comments on trends as part of a computerized interpretation are probably trivial in a programming sense but assessing trends is a critical part of reporting results and any interpretation algorithm that ignores this is missing a critical component.
Finally, this may be silly in a way and not necessarily anything an interpretation algorithm could ever be expected to recognize, but errors that are occasionally made in entering a patient’s demographics can also have a significant effect on interpretation. Mary Jane Smith is not likely male. It is unlikely for a patient to have a FVC that is 160% of predicted so their 62” height is more likely 6 feet 2 inches instead. I see these errors several times a year and as testing systems become more integrated with hospital and clinic information systems they will likely become less common. That is in the future, however, and even then it may be necessary to recognize when to override a patient’s “real” demographic information, transgender patients being an example.
Interpretation algorithms have always held promise but by solely focusing on the reported numerical results and ignoring quality and prior test information they will always lack sufficient accuracy to be reliable. As well as reliability they should also attempt to meet real-world PFT lab needs such as commenting on trends that don’t necessarily meet the strict criteria of PFT interpretation but are still an important part of the process.
References:
Aikins JS, Kunz JC, Shortliffe EH, Fallat RJ. PUFF: An expert system for interpretation of Pulmonary Function data. Comp Biomed Res 1983; 16:199-208.
Ellis JH, Perera SP, Levin DC. A computer program for calculation and interpretatio of Pulmonary Function studies. Chest 1975; 68: 209-213.
Poels PJP, Schermer TRJ, Schellekens DPA, Akkermans RP, de Vries Robbe PF, Kaplan A, Bottema BJAM, van Weel C. Impact of a spirometry expert system on general practitioners decision making. Eur Resp J 2008; 31: 84-92.
Veezhinathan M, Ramikrishnan S. Detection of obstructive respiratory abnormality using flow-volume spirometry and radial basis function neural networks. J Med Sys 2007; 31:461-465
Zarandi MHF, Zolnoori M, Moin M, Heidarnejad H. A fuzzy rule-based expert system for diagnosing asthma. Transaction E:Indus Eng 2010; 17: 129-142

PFT Blog by Richard Johnston is licensed under a Creative Commons Attribution-NonCommercial 4.0 International License.


