While reading a recently published article I found they had performed response to hypoxia and hyperoxia testing as part of the study. At one time or another in the past I’ve read about response to hypoxia testing but I’d never heard about hyperoxia testing before. I had some difficulty understanding their interpretation of the study’s results and for this reason I’ve spent some time reading up on the subject. I’m not sure this helped because there appears to be a lack of consensus not in only how to perform these tests but also in how they are interpreted, except perhaps in the most simplistic sense. Hypoxia and hyperoxia testing has been performed primarily to gain a deeper understanding of the way in which the peripheral (carotid) and central chemoreceptors function. There are a variety of sensor-feedback network models and results are often presented in terms of one model or another and this makes comparing results from different studies difficult. Interpretation and comparison is further complicated by the fact that results depend not only on the length of time that hypoxia or hyperoxia is maintained but whether the subject was exposed to hypoxia, hyperoxia or hypercapnia previously.
The ventilatory response to hypoxia tends to have three phases. First, once a subject begins breathing a hypoxic gas mixture within several seconds there is a rapid increase in minute ventilation known as the Acute Hypoxic Ventilatory Response (AHVR). Second, after several minutes there is a decrease in ventilation and this is usually called the Hypoxic Ventilatory Depression (HVD). Third, there is a progressive rise in ventilation after several hours which is related to acclimatization to altitude. It is the first phase, AHVR, that is most commonly measured during a hypoxic ventilatory response test. The actual length of time that is spent in any of these phases is widely variable between individuals and there is also a relatively large day-to-day variability within the same individual.
Although the majority of researchers have measured the response to hypoxia using changes in a subject’s minute ventilation the inspiratory pressure 100 milliseconds following occlusion of the mouthpiece (P100 or P0.1) has also been used.
One of the rare points of consensus is that almost all researchers agree that end-tidal CO2 (PetCO2) needs to be rigorously controlled and this is because increases or decreases in CO2 can affect the ventilatory response to hypoxia. For this reason PETCO2 needs to be monitored and it needs to be possible to add (or remove) CO2 to the breathing circuit and most commonly PetCO2 is maintained at 1-2 mm Hg above resting levels.
There is also general agreement that the changes in ventilation that occur with hypoxia are linearly related to SaO2 and for this reason, an oximeter is most commonly used to measure a subject’s level of hypoxia. One conceptual problem with this is that chemoreceptors are sensitive to the partial pressure of O2, not to oxygen saturation (this has been tested with controlled levels of carboxyhemoglobin), but since their output is non-linear (more probably hyperbolic) the ventilatory response better matches SaO2 than it does PaO2. Having said this, many researchers have measured PetO2 instead of SaO2 (PetO2 results are instantaneous while SaO2 lags behind) and then either plotted PetO2 logarithmically or made the assumption that PetO2 was equivalent to PAO2 and then calculated SaO2 using the Severinghaus formula.
Ignoring the more esoteric forms of testing there are generally three approaches to hypoxia testing and researchers have devised both open-circuit and closed-circuit systems for this. A steady-state approach is where a subject breaths gases with specific concentrations of O2 and CO2 and measurements are not taken until ventilation stabilizes. A transient approach is where specific concentrations of O2 and CO2 are applied only over a small number of breaths. A progressive approach is where FiO2 decreases throughout the test. Steady-state and transient approaches are usually performed with open-circuit systems whereas a progressive test tends to require a closed-circuit system.
There are, of course, both proponents and opponents to each approach. Although the steady-state approach allows for data to be obtained and averaged over a reasonable period of time it also risks crossing into the HVD phase of hypoxic response. The transient approach definitely limits measurements to the AHVR phase but the small number breaths that measurements are taken from can easily be affected by small variations in tidal volume and respiratory rate and the length of the test is too short for any significant change in SaO2 to occur and be measured. Because FiO2 decreases steadily during a progressive test, it is thought that the hypoxic response remains in the AHVR phase but it is not clear whether this has been verified or not.
Given the above, unless a specific research protocol is being followed, either a steady-state test limited to two or three minutes or a progressive test appear to be the most likely approaches toward obtaining meaningful and reproducible results.

During hypoxia testing with an open-circuit system the FiO2 is controlled by the flow rate of air and nitrogen into the system and PetCO2 is adjusted by an inflow of CO2. Measurements are usually made at one, two or three oxygen levels. Some researchers have adjusted the FiO2 in order to attain a specific SpO2 (often 90%, 85% or 80%), a specific PetO2 (such as 40, 60 or 80 mm Hg) or one or more preset FiO2’s (such as 5%, 8% or 12% O2).
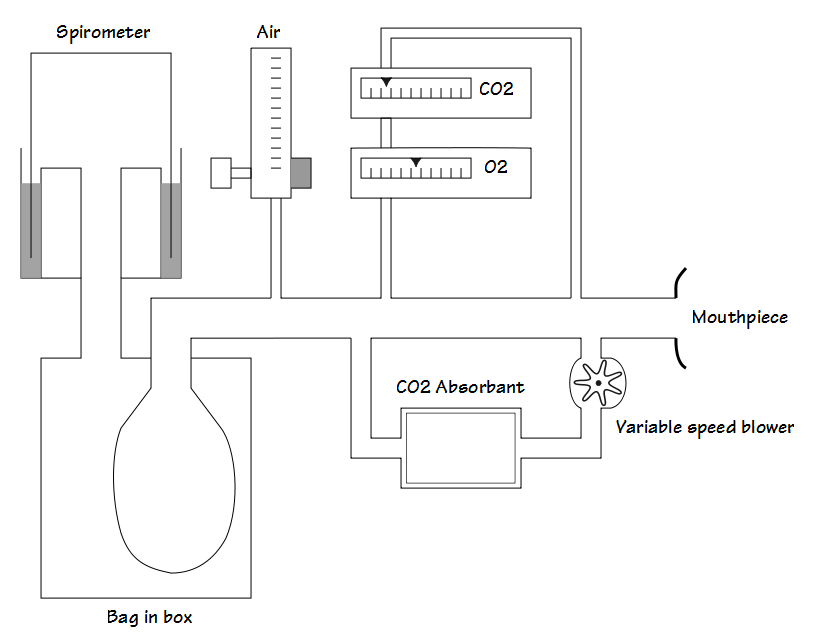
During hypoxia testing with a closed-circuit system the FiO2 progressively decreases as it is consumed by the subject and testing usually proceeds until a target SpO2 (often 80% or 85%) is attained. PetCO2 is adjusted by changing the flow rate of air sent through a CO2 scrubber.
For either type of test most commonly SpO2 is plotted against minute ventilation and the change in minute ventilation versus the change in SpO2 (ΔVe/ΔSpO2) is calculated. As mentioned SpO2 can also be plotted against inspiratory occlusion pressure P0.1 and the ΔP0.1/ΔSpO2 calculated.
So, what’s a normal hypoxic response?
There is no clear answer to this. I have over two dozen pulmonary function textbooks and ventilatory hypoxic response testing was mentioned in only three of them (Cotes, Ruppel, Wilson) and they declined to publish normal values. I’ve found mean ΔVe/ΔSpO2 values in three studies (Rebeck et al, Stickland et al, Zhang et al) and they ranged across a magnitude of difference (1.65 L/%SaO2, 0.11 L/%SaO2, 0.93 L/%SaO2) despite somewhat similar methodologies. Dean et al noted that a 5 minute exposure to isocapnic hypoxia (FiO2 between 8-10%) increased Ve on average by 37%. Finally, Garcia-Rio et al reported a P0.1 of 0.032 Kpa/%SaO2 (10.4 cmH2O/%SaO2) for normal subjects.
Variability between even normal subjects is high. Rebeck et al reported a range of 0.26 to 4.12 L/%SaO2 in a group of 9 normal subjects and Stickland et al reported a range of 0.05 to 0.67 L/%SaO2 in a group of 30 normal subjects.
As a complication the AHVR tends to be elevated at altitude, in sedentary individuals, in COPD, hyperthermia, thyrotoxicosis, hypercapnia, following a meal and if there has been prior exposure to hyperoxia. AHVR tends to be reduced in athletes, during sleep, during starvation, with hypocapnia and with myxedema.
Hypoxic ventilatory response is often measured and compared between groups or between interventions or over time, and frequently either the results are reported in non-standard ways or only the statistical significance of the differences is reported. In addition, because hypoxic response testing is intended as research on the peripheral and central chemoreceptors, mixtures of gases containing different levels of O2 and CO2 are often used and interpreting the results from these studies in terms of a simple ΔVe/ΔSpO2 response is particularly difficult.
Hyperoxic ventilatory response testing appears to be performed even less frequently than hypoxic ventilatory response testing. The response to hyperoxia is biphasic. First, when a subject initially starts breathing a hyperoxic gas mixture there tends to be a decrease in ventilation. Within approximately two minutes however, ventilation tends to increase and this second phase is called hyperoxic hyperventilation.
Both the hypoventilation and the hyperventilation phases of hyperoxia have been studied by various researchers using both open circuit and closed circuit systems. As with response to hypoxia there is a general consensus that PetCO2 needs to be controlled and again this is because changes in CO2 affect the ventilatory response to hyperoxia.
Notably, there appears to be a dose relationship during the hyperventilation phase in that higher FiO2’s are associated with a higher minute ventilation. For prolonged hyperoxic studies understanding the dose relationship is important since investigators have used hyperoxic FiO2’s anywhere from 24% to 100%. For studies of the initial phase of hyperoxic hypoventilation phase it is unclear if there is a dose relationship since most studies appear to have been performed with FiO2’s near 100%.
During hyperoxia, the initial phase of hypoventilation has been attributed to the inhibition or denervation of the peripheral chemoreceptors. Research has shown that the hyperventilatory phase is due to the action of the central chemoreceptors and in particular it has been suggested that hyperoxia and the reactive oxygen species stimulates the central CO2 receptors.
One interesting point is that research on the hyperoxic ventilatory response calls into question the results from response to CO2 testing. The gas mixture that is most commonly used in response to CO2 tests is 7% CO2, 93% O2 and the elevated FiO2 has been shown to be able act either as a respiratory depressant or as a respiratory stimulant depending on the length of the test and the FiCO2. This is a confounding factor that is rarely appreciated.
So what’s a normal hyperoxic ventilatory response?
Again, there is no clear answer to this. Hyperoxic ventilatory response testing is not mentioned in any of my pulmonary function textbooks. Stickland et al reported that the initial hypoxic hypoventilatory response for normal subjects was a decrease in Ve of 0.73 L and for those with COPD the decrease in Ve was 2.62 L. As mentioned, there is a dose relationship for the hyperventilatory phase. Becker et al reported that in normal subjects Ve increased by 21% at 30% O2, an increase of 61.3% at 50% O2 and 114.7% at 70% O2. As with response to hypoxia testing the range of responses is also quite wide since Becker et al noted that increases in ventilation ranged from +43% to +287% at an FiO2 of 70%.
Although the response the hypoxia and hyperoxia are physiologically important, the clinical utility of hypoxic or hyperoxic ventilatory response testing appears to be exceptionally limited (if it exists at all). This partly due to the lack of clear normal values and standardized approaches to testing but even more so because trying to understand the ventilatory response to hypoxia or hyperoxia solely in terms of a change in ventilation is a misleading oversimplification. There is also a wide range of responses even among normal subjects so it is unclear what would be considered abnormal.
The interaction between peripheral and central chemoreceptors, and particularly how the different ventilatory phases arise, is complex and a number of competing models have been proposed. How an individual’s response to hypoxia, hyperoxia and hypercapnia is interpreted depends greatly on which of these models is selected and to be honest, despite careful reading many of the fine points of these models eludes me. On the plus side though, I have a much better understanding the paper that started the question of hypoxic and hyperoxic testing in the first place, so for me at least it wasn’t a waste of time.
References:
Becker HF, Polo O, McNamara SG, Berthon-Jones M, Sullivan CE. Effect of different levels of hypoxia on breathing in health subjects. J Appl Physiol 1996; 81(4): 1683-1690.
Cotes JE, Chinn DJ, Miller MR. Lung Function. Physiology, Measurement and Application in Medicine. 6th Edition. Published by Blackwell, 2006.
Dahan A, DeGoede J, Berkenbosch A, Olievier ICW. The influence of oxygen on the ventilatory response to carbon dioxide in man. J Physiol 1990; 428: 485-499.
Dean JB, Mulkey DK, Henderson RA, Potter SJ, Putnam RW. Hyperoxia, reactive oxygen species and hyperventilation: oxygen sensitivity of brain stem neurons. J Appl Physiol 2004; 96: 784-791.
Duffin J. Measuring the ventilatory response to hypoxia. J Physiol 2007; 584(1): 285-293.
Garcia-Rio F, Pino-Garcia JM, Racionero MA, Terreros-Caro JG, Gomezx-Mendieta MA, Prados C, Villasante C. Long-term within-subject variability of inspiratory neural drive response to hypoxia. Chest 1998; 114: 521-525.
Honda Y, Tani H, Masuda A, Kobayashi T, Nishino T, Kimura J, Masuyama S, Kuriyama T. Effect of prior O2 breathing on ventilatory response to sustained isocapnic hypoxia in adult humans. J Appl Physiol 1996; 81(4): 1627-1632.
Jensen D, Mask G, Tschakovsky ME. Variability of the ventilatory response to Duffin’s modified hyperoxic and hypoxic rebreathing procedure in health awake humans. Respiratory Physiology and Neurobiology 2010; 170: 185-197
Liang PJ, Bascom DA, Robbins PA. Extended models of the ventilatory response to sustained isocapnic hypoxia in humans. J Appl Physiol 1997; 82(2): 667-677.
MacFarlane DJ, Cunningham DJC. Dynamics of the ventilatory response in man to step changes in end-tidal carbon dioxide and of hypoxia during exercise. J Physiology 1992; 457: 539-557.
Rebeck AS, Campbell EJM. A clinical method for assessing the ventilatory response to hypoxia. Am Rev Resp Dis 1974; 109: 345-350
Ruppel, G. Manual of pulmonary function testing. 8th Edition. Published by Mosby, 2003.
Stickland MK, Fuhr DP, Edgell H, Byers BW, Bhutani M, Wong EYL, Steinback CD. Chemosensitivity, cardiovascular risk and the ventilatory response to exercise in COPD. PloS One 2016; 11(6): e0158341.
Weil JV, Zwillich CW. Assessment of ventilatory response to hypoxia. Methods and interpretation. Chest 1976; 70: S124-S128.
Wilson AF, editor. Pulmonary function testing indications and interpretations. A project of the California Thoracic Society. Published by Grune and Stratton, 1985.
Zhang S, Robbins PA. Methodological and physiological variability within the ventilatory response to hypoxia in humans. J Appl Physiol 2000; 88: 1924-1932.

PFT Blog by Richard Johnston is licensed under a Creative Commons Attribution-NonCommercial 4.0 International License