I was reading James Hansen’s textbook on pulmonary function testing and ran across a spot where he made a minor criticism of the NHANESIII (Hankinson et al) reference equations for the FEV1/FVC ratio. Specifically he noted that the NHANESIII equation ignored height and only used age as a variable but that when he compared the directly calculated FEV1/FVC ratio with one indirectly derived from predicted FEV1 and FVC there was a discrepancy across the normal ranges of height of up to 2.4%.
I had also noticed this discrepancy and wrote about it a while back but at the time I’d only been discussing my lab’s adoption of the NHANESIII reference equations. Hansen’s observation intrigued me, so I decided to re-visit this issue more systematically.
To do this I’ve taken 23 different reference equations for men and women and a variety of ethnicities and plotted the change in the FEV1/FVC ratio versus height, and then repeated this across a range of ages.
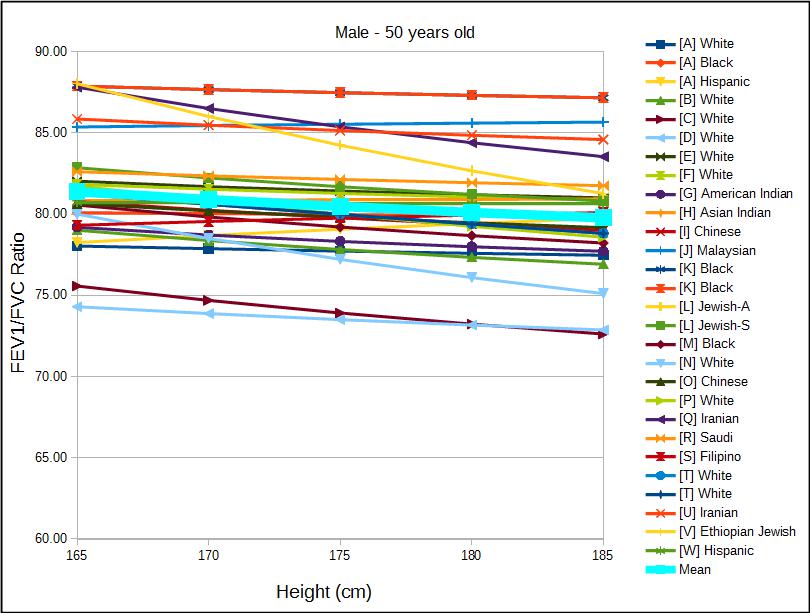
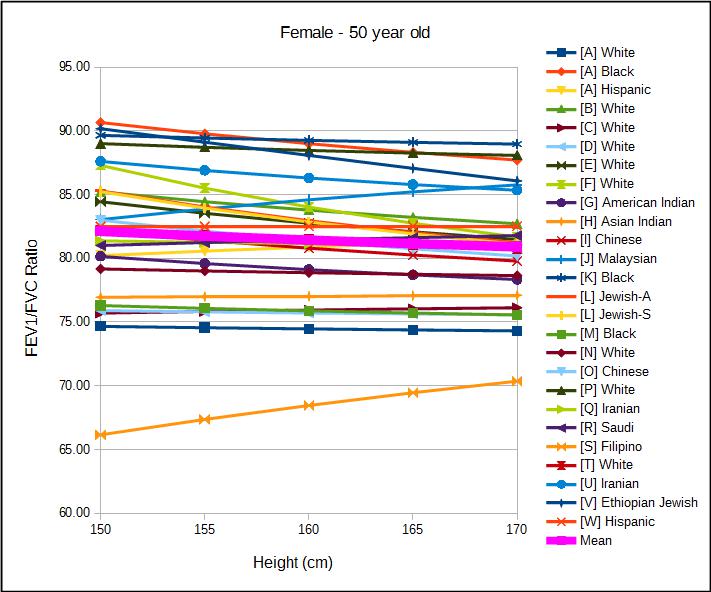
When I did this I saw that almost universally the FEV1/FVC ratio decreases with increasing height and that the magnitude of the decrease grew smaller with increasing age.
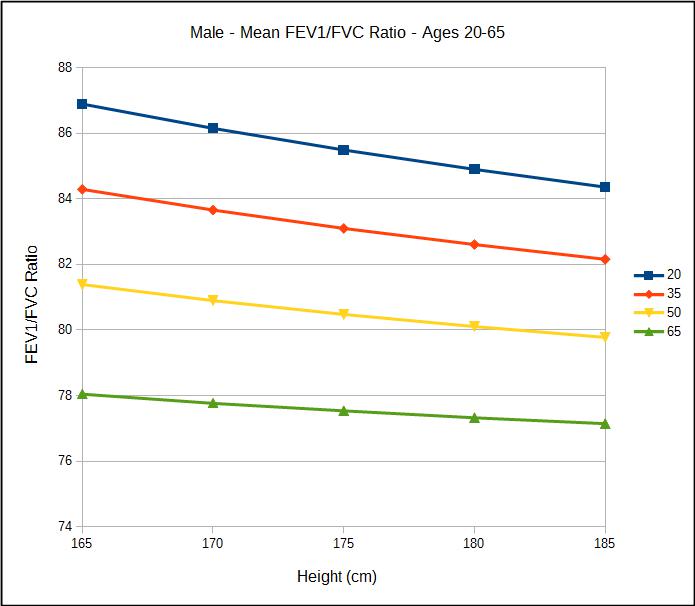
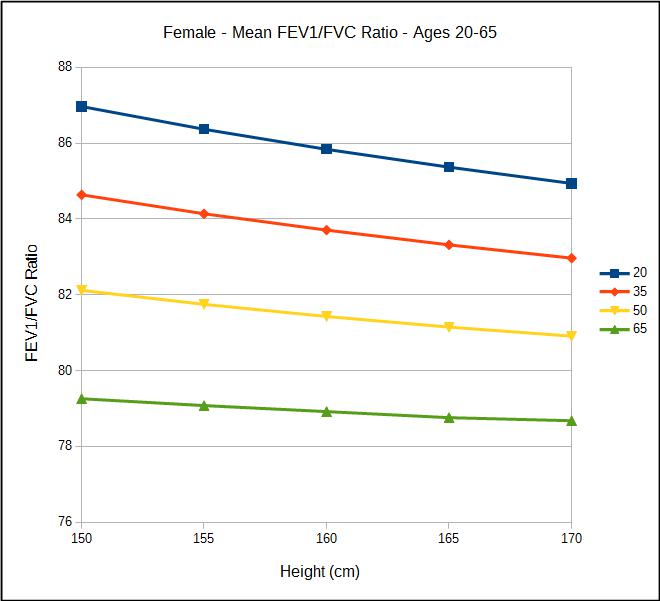
For men at age 20, the average predicted FEV1/FVC ratio for a height of 165 cm was 86.89 and for a height of 185 cm was 84.36, a difference of 2.53 percent. At age 65, the average predicted FEV1/FVC ratio for a height of 165 cm was 78.05 and for a height of 185 cm was 77.15, a difference of 0.90 percent. For women at age 20 the average predicted FEV1/FVC ratio for a height of 150 cm was 86.97 and for a height of 170 cm was 84.94, a difference of 2.03 percent. At age 65m the average predicted FEV1/FVC ratio for a height of 150 cm was 79.26 and for a height of 170 cm was 78.68, a difference of 0.58 percent.
This matters because an FEV1/FVC ratio below the lower limit of normal (LLN) is an indication of airway obstruction. The NHANESIII LLN for FEV1/FVC ratio does not take height into consideration and means that a tall individual is more likely to be considered to be below the LLN and a short individual is more likely to remain above the LLN.
I have a great deal of respect for the NHANESIII study since it includes an exceptionally large and ethnically diverse study group and a sophisticated statistical analysis was performed on the results. Their reason for excluding height as a factor for the FEV1/FVC ratio reference equation was not discussed however, other than stating that “Only age is needed…”. I have tended to accept this because my lab has seen some exceptionally short and exceptionally tall individuals and the predicted FEV1/FVC ratio derived from their predicted FEV1 and predicted FVC appeared to be in error.
| Male 48” | Observed: | Predicted (M) | %Pred (M): | Predicted (N) | %Pred (N) |
| FVC: | 1.72 | 1.69 | 102% | 2.01 | 86% |
| FEV1: | 1.35 | 1.68 | 82% | 1.66 | 81% |
| FEV1/FVC Ratio: | 78.6 | 97.5 | 81% | 78.4 | 100% |
| Male 84” | Observed: | Predicted (M) | %Pred (M): | Predicted (N) | %Pred (N) |
| FVC: | 8.24 | 7.40 | 111% | 8.01 | 103% |
| FEV1: | 5.41 | 5.44 | 97% | 6.36 | 85% |
| FEV1/FVC Ratio: | 65.5 | 73.5 | 89% | 81.45 | 80% |
(M) = Morris 1971 (N) = NHANESIII
These examples are from several years ago when my lab was still using Morris’ 1971 reference equations and the problem was more obvious for the shorter of these two individuals but in either case it was apparent there was a problem. Our response at the time was to use the predicted NHANESIII FEV1/FVC ratio in place of Morris’ predicted when the results were interpreted.
A good part of the problem probably lies with the Morris reference equations for individuals that are outliers in height. When the predicted FEV1/FVC ratio is calculated from the NHANESIII predicted FEV1 and FVC it is 82.6 for the shorter individual and 79.4 for the taller. Even so, the difference between the directly and indirectly calculated NHANESIII FEV1/FVC ratios are 4.60% and 2.05%.
I have been unable to find any study that has directly addressed the issue of height versus FEV1/FVC ratio. Given that 44 out of 46 reference equations show a decrease in the FEV1/FVC ratio with increasing height I have to think that this relationship is correct. My only thoughts about why this is the case would be that airway dimensions do not scale exactly with lung volume. It is still pretty amazing that the FEV1/FVC ratios are almost exactly the same over a very wide range of lung volumes but I don’t think we should be surprised that there is a difference.
Based on this observation, I think this means that the FEV1/FVC ratio should be calculated from predicted FEV1 and FVC. I’d prefer to continue to use the NHANESIII set of reference equations but there is no LLN for an indirectly calculated FEV1/FVC ratio. The LLNs for the directly calculated FEV1/FVC ratio range from 88.3% to 89.9% (based on gender and ethnicity) of the predicted FEV1/FVC ratio. I think that these would probably make a good estimate of the LLN for an indirectly calculated FEV1/FVC ratio.
| Caucasian: | Black: | Hispanic: | |
| Male: | 89.0% | 88.3% | 89.9% |
| Female: | 89.25% | 88.35% | 89.9% |
When reference equations from a large number of studies are compared a relationship between height and the FEV1/FVC ratio becomes evident. The NHANESIII reference equation for the FEV1/FVC ratio does not use height as a factor. Because of this, taller individuals are more likely to be classified with airways obstruction than shorter ones and this is likely because airway dimensions and lung volumes scale at different rates. When the NHANESIII reference equations are used the best solution would be to derive the FEV1/FVC ratio from the predicted FEV1 and FVC instead of using the reference equation for the FEV1/FVC ratio.
References:
Hansen JE. Pulmonary Function Testing & Interpretation. Jaypee Brothers Medical Publishers, 2011.
[A] Hankinson JL, Odencrantz JR, Fedan, KB. Spirometric reference values from a sample of the general U.S. Population. Amer J Resp Crit Care 1999; 159: 179-187
[B] Gutierrez C, et al. Reference values of pulmonary function tests for Canadian caucasians. Can Respir J 2004; 6: 414-424.
[C] Morris JF, Koski A, Johnson LC. Spirometric standards for healthy nonsmoking adults. Am Rev Resp Dis 1971; 103: 57-67.
[D] Morris JF, Koski A, Temple WP, Claremont A, Thomas DR. Fifteen-year interval spirometric evaluation of the Oregon Predictive equations. Chest 1988; 93: 123-27
[E] Knudson RJ, Lebowitz MD, Holberg CJ, Burrows B. Changes in the normal maximal expiratory flow volume curve with growth and aging. Am Rev Resp Dis 1983; 127: 725-734
[F] Johannessen A, Lehmann S, Omenaas ER, Side GE, Bakke PS, Gulsvik A. Post-bronchodilator spirometry reference values in Adults and implications for disease mangement. Amer J Resp Crit Care Med 2006; 173(12): 1316-1325
[G] Marion MS, Leonardson GR, Rhoades ER, Welty TK, Enright PL. Spirometry reference values for American Indian adults. Chest 2001; 120: 489-495
[H] Fulambarker A, Copur AS, Javen A, Jere S, Cohen ME. Reference values for pulmonary function in Asian Indians living in the United States. Chest 2004; 126: 1225-1233
[I] Ip MS, Ko FW, Lau AC, Yu W, Tang K, Choo K, MM Chan-Yeung. Updated spirometric reference values for Adult Chinese in Hong Kong and implications on clinical utilization. Chest 2006; 129: 384-392.
[J] Singh R, Singh HJ, Sirisinghe RG. Spirometric studies in Malayasian between 13 and 69 years of age. Med J Malaysia 1993; 48: 175-184
[K] Perfura-Yone EW, Kanko-Nguekam NF, Kengne AP, Balkissou AD, Noseda A, Kuaban C. Spirometric Reference Equations for semi-urban and urban Bantu Cameroonians. Open J Resp Dis 2013; 3: 164-174.
[L] Steinvil A, Fireman E, Wolach O, Rebhun U, Cohen M, Shapira I, Berliner S, Rogowski O. The effect of ethnic origin on pumonary prediction equations in a Jewish immigrant population. Respiratory Medicine 2008; 102: 919-926.
[M] Mengesha YA, Mekonnen Y. Spirometric lung function tests in normal non-smoking Ethiopian men and women. Thorax 1985; 465-468.
[N] Roberts CM, MacRae KD, Winning AJ, Adams L, Seed WA. Reference values and prediction equations for normal lung function in a non-smoking white urban population. Thorax 1991; 46: 643-650.
[O] Lam DCL, Fong DYT, Yu WC, Ko FWS, Lau ACW, Chan JWM, Choo KL, Mok TYW, Tam CY, Ip MSM, Chan-Yeung MMW. FEV3, FEV6 and their derivatives for detecting airflow obstruction in adult Chinese. Int J Tuberc Lung Dis 2012; 16(5): 681-686.
[P] Pereira CADC, Sato T, Rodrigues SC. New Reference Values for forced spirometry in white adults in Brazil. J Bras Pneumol 2007; 33: 397-406.
[Q] Razi E, Moosavi GHA, Akbari H. Spirometric standards for healthy Iranians dwelling in the centre of Iran. Tanoffos 2005; 4(15): 19-26.
[R] Al Ghobain MO, Ahamad EH, Alorainy HS, Hazmi MA, Al Moamary MS, Al-Hajjaj MS, Idress M, Al-Jahdali H, Zeitouni M. Spirometric reference standards for healthy nonsmoking Saudi adults. Clinical Respir J 2014; 8: 72-78.
[S] Roa CC, Zaldivar CA, Salonga RC, Bobadilla J, Lansang MA, Reodica R, Balgos A, Blanco J, Tanchuco JQ. Normal standards for ventilatory function in adult Filipinos. Phillipine J Internal Med, 2013; 51(1): 1-6.
[T] Kuster SP, Kuster D, Schindler C, Rochat MK, Braun J, Held L, Brandli O. Reference equations for lung function screening of healthy never-smoking adults aged 18-80 years. Eur Respir J 2008; 31: 860-868.
[U] Golshan M, Nematbakhsh M, Amra B, Crapo RO. Spirometric reference values for a large Middle Eastern population. Eur Respir J 2003; 22: 529-534.
[V] Bibi H, Goldsmith JR, Vardi H. Racial or ethnic variations in spirometric lung function norms. Recommendations based on study of Ethiopian Jews. Chest 1988; 93(5): 1026-1030.
[W] Crapo RO, Jensen RL, Lockey JA, Aldrich V, Elliott CG. Normal spirometric values in healthy Hispanic Americans. Chest 1990; 98(6):1435-1439.

PFT Blog by Richard Johnston is licensed under a Creative Commons Attribution-NonCommercial 4.0 International License
So, by using the predicted values of FEV1 and FVC for the FEV1/FVC ratio, the, what can be a significant “spread” in LLN depending on an individual patient’s height, would already be factored-in?
If I’m following correctly, the fact that there is no height chart established for FEV1/FVC Ratio (as there is for a standalone FVC predicted), then, because height can uniquely effect the “FEV1/FVC Ratio Observed” test value, a “height adjustment” in the FEV1/FVC Ratio LLN is needed.
I’ve wondered why the BTS standard states that both FEV1 and FVC values have to be abnormal to be considered an indication of obstruction: it can’t be just the FEV1/FVC Ratio abnormal (and the FEV1 normal) to be considered obstruction; has to be both according to the BTS. It can seem as if they don’t “trust” just the FEV1/FVC Ratio, in and of itself, as a reliable value in diagnosis.
Also, if lungs typically develop in an individual, up to the age of 25, wouldn’t, say, a former school athlete (all things otherwise being equal) taking a Spirometry test have, because of an increased volume capacity, a lower FEV1/FVC Ratio than a “normal” patient taking the same test?
In other words, of all the most prominent values in Spirometry testing: FEV1; FVC; and FEV1/FVC Ratio, isn’t the FEV1/FVC Ratio on a lower plateau of reliability, and the BTS “has a point?”
Good article.
Thanks, Ed
Ed –
A statistical analysis was not performed for the NHANESIII study on the indrectly calculated FEV1/FVC ratio. I presume, however, that the LLN for the indirect FEV1/FVC can’t be much different than for the directly calculated FEV1/FVC ratio.
Indirectly calculating the FEV1/FVC ratio would provide a height adjustment automatically.
The British Thoracic Society guidelines are based on the GOLD standards, but they don’t say that both FVC and FEV1 have to be abnormal. For an obstructive disorder they state that FEV1 should be less than 80% of predicted, FVC is usually (usually doesn’t mean always) reduced but to a lesser extent than FEV1 and the FEV1/FVC ratio is reduced (<0.7). The GOLD guidelines have been criticized (and I think deservedly so) for over-diagnosing COPD in older patients and under-diagnosing obstruction in younger patients.
No, what I'm saying is that there is an apparent relationship between height and the FEV1/FVC ratio. A taller person would normally have a slightly lower FEV1/FVC ratio than a shorter person. The difference is small but this becomes important when an individual's FEV1/FVC ratio is near the LLN.
As long as a spirometry effort meets criteria for acceptability there is no reason to believe the FEV1/FVC ratio is less reliable than the FEV1 or FVC. Having said that, when moderate to severe airway obstruction is present an individual may not be able to blow out long enough to get their "real" FVC and the FEV1/FVC ratio would be overestimated, but in this case the FVC is just as "un-reliable" as the FEV1/FVC ratio. The ATS/ERS standards for interpretation use the FEV1/FVC ratio's LLN as the primary decision point for airway obstruction so they certainly think it is reliable.
Regards,
- Richard
Richard, thanks for your reply.
Pardon me, I meant The National Institute For Clinical Excellence (NICE), not the BTS, that states that a diagnosis of COPD should include both: FEV1 <80% and FEV1/FVC Ratio <70%. And, apparently, these values are to be Post-Bronchodialator. That impressed me as to the effect that this standard would have on borderline cases.
They included comments on the NICE standards with regard to false positives v. false negatives at the bottom of this study in the "Discussion" section.
http://respiratory-research.com/content/13/1/13
Ed
Ed –
Both NICE and the BTS are using the GOLD standard for diagnosing COPD. The Respiratory Research article you linked to criticizes both the LLN and GOLD approach to diagnosing COPD. I find this criticism a bit disingenuous since LLN was not intended solely as a tool for diagnosing COPD but as a general indicator for airway obstruction. There always needs to be additional evidence on top of an FEV1 < LLN (or even a FEV1 < 80% and FEV1/FVC ratio <0.7) to diagnose COPD because COPD should not be diagnosed solely from spirometry no matter what standard you are using. - Richard