The VA/TLC ratio

I was reading James Hansen’s textbook on pulmonary function testing (one of my more interesting reads lately) and in passing he mentioned using the VA/TLC ratio as a way to measure ventilation inhomogeneity. The VA/TLC ratio has also been called the Va,eff/VA ratio and the VA’/VA ratio by different researchers but regardless of what it is called it is the ratio between a single-breath TLC measurement (VA) taken from a DLCO test and a multi-breath (helium dilution or N2 washout) or plethysmographic TLC.

A single-breath TLC regardless of whether helium, nitrogen, methane or argon is used tends to underestimate TLC even in individuals with normal lungs (and if the ratio > 1.0 then there is likely a technical problem with either the lung volume or DLCO measurements). This is mostly because of the limited time a single breath of tracer gas has to mix and diffuse evenly throughout the lungs. The idea is that a low VA/TLC ratio indicates poor gas mixing and therefore an elevated ventilation inhomogeneity.

The VA/TLC ratio is a relatively simple approach towards measuring ventilation inhomogeneity largely because the results can be derived from regular TLC and DLCO measurements. It was first proposed as a measurement over 40 years ago but despite having several notable proponents it has not achieved any particular level of acceptance.

Part of the reason for this may be that there is limited agreement about what a constitutes a normal VA/TLC ratio. Cotes et al suggest that the ratio decreases slightly with age and stated that the normal range is 0.9 to 1.0 at age 20 and 0.85 to 0.95 at age 60. Roberts et al, however, in a study with a reasonably large population (n=379) selected for the presence or absence of certain conditions (normal, asthma, COPD) found no particular correlation with age (or height, weight and gender) and stated that in individuals with normal FEV1/FVC ratios the LLN was 0.828. Punjabi et al in a retrospective study of 5369 individuals unselected except for the presence of acceptable test quality stated that for FEV1/FVC ratios above 0.70 the VA/TLC ratio was 0.98.

There is general agreement however, that the strongest correlation between TLC and VA is an individual’s FEV1/FVC ratio.

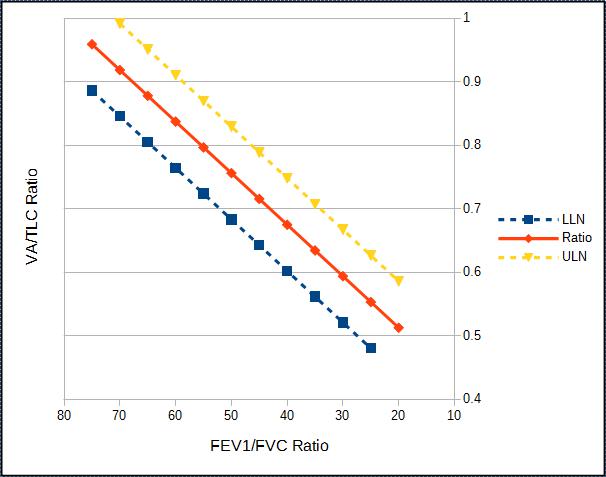
VA/TLC ratios from Burns et al.

The correlation between VA/TLC ratio and the FEV1/FVC ratio from Burns et al.

VA_TLC_Ratio_Formula_Burns

Continue reading

Evaluating spirometry predicted equations for the elderly

I’ve mentioned previously that the PFT Lab I am associated with recently went through a major hardware and software update. As part of this update we decided to change spirometry predicted equations to NHANESIII. The lab has used the Morris equations for at least the last 25 years and this has caused us to revisit a number of issues associated with interpretation of results, one of which is age.

The software update included the NHANESIII equation set but when we selected it we found that the software would not calculate predicted values for patients over the age of 80. The manufacturer said that this was because that was as far as the age range went in the original NHANESIII study and for this reason they could not extend it. Furthermore, their recommendation was to use the Crapo or Knudsen equations for ages above 80 because they were “more linear”. Continue reading

FEV1/FVC ratio and height

The PFT Lab I work with has recently gone through a major software and hardware upgrade. As part of this process we made the decision to switch our spirometry predicted equations to NHANESIII. The lab has been using the Morris predicteds for at least the last 25 years and this switch has led us to re-visit some of the issues involved in interpreting spirometry results.

More than one person that I’ve known and respected has said that spirometry is all about FEV1 and I think this is a true statement. There is a lot of other information you can get from a Forced Vital Capacity but it always comes back to FEV1.

Stepping aside from the mechanical and patient issues involved in obtaining an FEV1, once you have an acceptable FEV1 measurement how do you assess it? There is always the percent predicted and the lower limit of normal (LLN) but a reduced or normal FEV1 by itself cannot differentiate between an obstructive, restrictive or normal pattern. This is where the FEV1/FVC ratio comes in and an interesting question is where the predicted values for this ratio come from.

Continue reading