Thinking about the past

This is the time of the year when it’s traditional to review the past. That’s what “Auld lang syne”, the song most associated with New Year’s celebrations, is all about. I too have been thinking about the past but it’s not been about absent friends, it’s been about trend reports and assessing trends.

In the May 2017 issue of Chest, Quanjer et al reported their study on the post-bronchodilator response in FEV1. I’ve discussed this previously and they noted that the current ATS/ERS standard for a significant post-bronchodilator change of ≥12% and ≥200 ml penalized the short and the elderly. Their finding was that a significant change was better assessed by the absolute change in percent predicted (i.e. 8%) rather than a relative change.

I’ve thought about how this could apply to assessing changes in trends ever since then. The current standards for a significant change in FEV1 over time (also discussed previously) is anything greater than:

which is good in that it is a way to reference changes over any arbitrary time period but it also looks at it as a relative change (i.e. ±15%). A 15% change however, comes from occupational spirometry, not clinical spirometry, and the presumption, to me at least, is that it’s geared towards individuals who have more-or-less normal spirometry to begin with.

A ±15% change may make sense if your FEV1 is already near 100% of predicted but there are some problems with this for individuals who aren’t. For example, a 75 year-old 175 cm Caucasian male would have a predicted FEV1 of 2.93 L from the NHANESIII reference equations. If this individual had severe COPD and an FEV1 of 0.50 L (17% of predicted), then a ±15% relative change in FEV1 would ±0.075 L (75 ml). That amount of change is half the acceptable amount of intrasession repeatability (150 ml) in spirometry testing and it’s hard to consider a change this small as anything but chance or noise. It’s also hard to consider this a clinically significant change. Continue reading

Is there such a thing as a normal decrease when the FEV1 isn’t normal?

I’ve mentioned before that my lab’s database goes back to 1990, so we now have 27 years of test results available for trending. At least a couple times a week we have a patient who was last seen 10 or even 20 years ago. When I review their results I try to see if there has been any significant change from their last tests. Since the last tests are often quite some time in the past the changes in an absolute sense are often noticeably large. The question then becomes whether or not these changes are normal.

Although the ATS/ERS, NIOSH and ACOEM standards for spirometry address changes over time they don’t specifically discuss changes over a decade or longer. Instead, without indicating a time period (other than saying a year or more), the concensus is that a change greater than 15% in age-adjusted FVC or FEV1 is likely to be significant. A change in absolute values greater than:

Or if the current FEV1 is less than:

Then the change is likely significant.

This sounds fairly reasonable and although we could quibble about the importance of how quickly or slowly this age-adjusted 15% change occurs and how well it applies when the patient’s latest age is beyond the reference equation’s study population (we have a fair number of 90+ year old patients nowadays) or when it’s across a developmental threshold (adolescent to adult), it’s still a good starting point.

I’ve been more or less following these rules for the last several years, when the results for a patient whose last test was 18 years ago came across my desk. The FEV1 from the current spirometry was 71% of predicted and the FEV1 from 18 years ago was 70% of predicted. Strictly speaking the absolute change was about -15% (the FEV1 was 2.06 L in 1999 and 1.76 L in 2017, a 0.30 L change) but when adjusted for the change in age, that’s only 40% what a significant change would need to be:

Given that the FEV1 percent predicted from both the older and newer test were essentially identical I automatically started to type “The change in FEV1 is normal for the change in age” when it suddenly occurred to me that neither FEV1 was normal in the first place so how could I be sure the change be normal?

Continue reading

When no change is a change, or is it?

I was reviewing a spirometry report last week and when I went to compare the results with the patient’s last visit I noticed that the FVC and FEV1 hadn’t changed significantly. However, the previous results were from 2009 and when the percent predicted is considered there may have been a significant improvement.

2009 Observed: %Predicted:
FVC: 2.58 87%
FEV1: 1.60 72%
FEV1/FVC: 62 82%
2016 Observed: %Predicted:
FVC: 2.82 104%
FEV1: 1.65 82%
FEV1/FVC: 59 79%

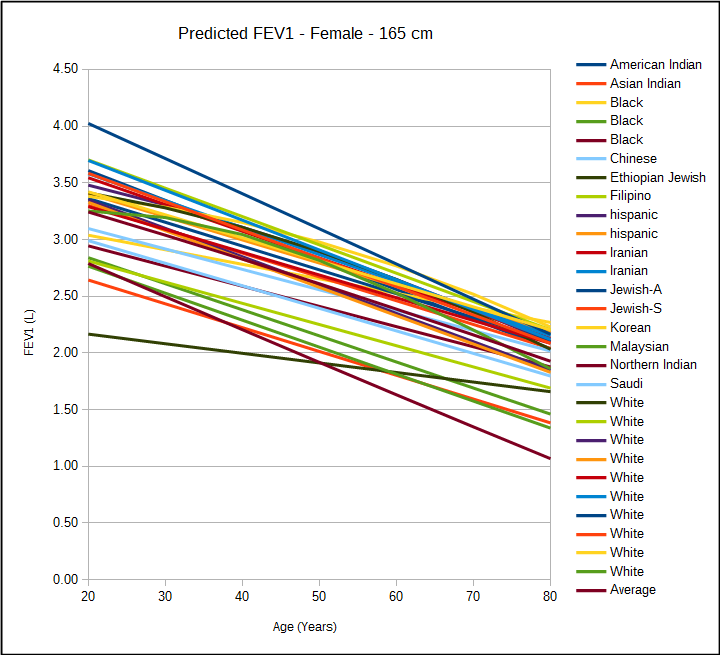
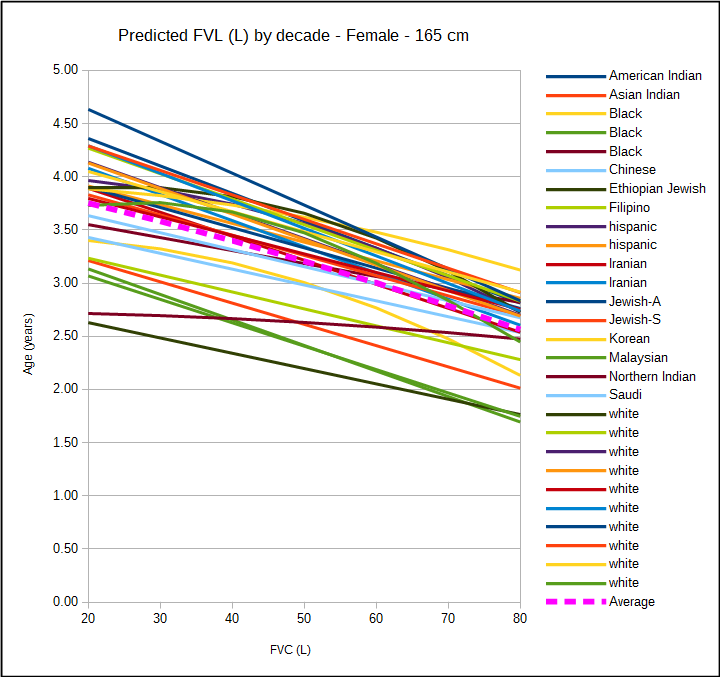
The answer to whether or not there was an improvement would appear to depend on what changes you’d normally expect to see in the FVC and FEV1 over a time span of 7 years. The FVC and FEV1 normally peaks around age 20 to 25 and then declines thereafter.

fvc_predicted_l

fev1_predicted_l

[more] Continue reading

Assessing changes in DLCO

We have a number of patients who have spirometry and DLCO testing performed at regular intervals. I’ve noticed that every so often DLCO results change significantly without a change in spirometry (or lung volumes) or there’s a modest change in spirometry and a marked change in DLCO. I’ve been concerned that this may be a symptom of problems with our DLCO (CO/CH4) gas analyzers and at least once recently this kind of discrepancy did lead to having an analyzer being serviced. Realistically though, the gas analyzers are routinely passing their calibrations and when I look at the trends in calibration there hasn’t been any systematic drift. This doesn’t rule out intermittent problems however, so in order to find out whether these changes in DLCO are “real” or an artifact of our testing systems I decided to see if taking a closer look at the results would help resolve this.

First, what constitutes a significant change in DLCO?

My lab’s current working definition is an increase or decrease in DLCO that is 2.0 ml/min/mmHg or 10%, whichever is greater. This is slightly different from the ATS/ERS DLCO intra-session repeatability requirements (3.0 ml/min/mmHg or 10%) and may mean that we’re setting the bar too low but there’s a difference between intra-session and inter-session variability. Specifically, we average the two closest results (assuming there are at least two tests of good quality) from one testing session to another and it is the inter-session average we are comparing, not individual tests and for this reason we feel that a smaller change can be relevant.

Note: The ATS/ERS statement on interpretation does discuss inter-session DLCO variability but there it is expressed as >7% within the same day and >10% year to year without setting an upper limit. The year to year value is based solely on a study from 1989 on eight individuals using a manually operated testing system (Collins Modular Lung Analyzer) that used a semi-automated alveolar sampling bag and for this reason it’s hard to be sure it is still relevant.

Second, which test parameters have the greatest effect on calculated DLCO?

As a reminder, the DLCO formula is:

Continue reading

Why haven’t computerized interpretations gotten any better?

Almost all pulmonary function test systems seem to come with a module that can perform a computerized interpretation of PFT results. Their accuracy has been studied occasionally, often by the developers of a particular algorithm and just as often a rosy picture is painted. Given their limited (and likely pre-cleaned) data sets I am sure this is accurate as far as it goes. I have done my own admittedly very unscientific comparison and would say that for two-thirds of the patients tested the results are probably okay. The other third? Varying degrees of not so much.

This concerns me because the very locations that could use the expert assistance of computerized interpretation, small clinics and doctor’s offices where inexperienced and under-trained staff are usually tasked to perform the tests and where this would be most useful, cannot rely on it. This fact was highlighted in a recent report in the European Respiratory Journal which showed that computerized interpretation did not improve the quality of care in general practitioners offices.

Computerized interpretation of pulmonary function tests have been around for at least 40 years. At one time or another developers have used expert systems, branching logic, fuzzy logic and neural networks. Algorithms have been tweaked and updated as our understanding of pulmonary function testing has improved but none are essentially any better or more accurate now than in the 1970’s.

Continue reading