CPET Test Interpretation, Part 4: Interpretation and Summary

After having gone through the descriptive checklists for ventilatory, gas exchange and circulatory limitations the reason(s) for a patient’s exercise limitation, if any, should be reasonably clear. However, one of the first questions that should be asked when reading an exercise test is what was the purpose of the test?

  • Maximum safe exercise capacity for Pulmonary Rehab?
  • Rule in/rule out exercise-induced bronchospasm?
  • Pre-operative assessment?
  • Dyspnea of uncertain etiology?
  • What is the primary limitation to exercise (pulmonary or cardiac)?
  • Is deconditioning suspected?

The interpretation and summary should address these concerns.

The descriptions checklist is the main groundwork for the actual interpretation and any abnormal findings there may signal the need for specific comments. The interpretation should start by indicating whether or not the patient’s exercise capacity was normal and then should indicate the presence or absence of any limitations.

What was the patient’s maximum exercise capacity (maximum VO2)?

  • >120% = Elevated
  • 80% to 120% = Normal
  • 60% to 79% = Mildly reduced
  • 40% to 59% = Moderately reduced
  • <40% = Severely reduced

Example: There was a {elevated | normal | mildly reduced | moderately reduced | severely reduced} exercise capacity as indicated by the maximum oxygen consumption of XX%.

Continue reading

2019 ATS/ERS Spirometry Standards

The 2019 ATS/ERS Spirometry Standards were recently released. The standards are open-access and can be downloaded without charge from the October 15th issue of the American Journal of Respiratory and Critical Care Medicine. Supplements are available from the same web page.

The 2019 Spirometry Standards have been extensively re-organized with numerous updates. Notably, a number of sections that were previously discussed in the 2005 General Considerations for Lung Function Testing have been updated and included in the 2019 Spirometry Standards. Also notably, a number of stand-alone spirometry tests, including the Flow-Volume Loop, PEF and MVV are not included in the 2019 Standards.

An overview of changes and updates from the 2005 Spirometry Standards are detailed within the 2019 Spirometry Standards (page e71, column 1, paragraph 2) and in the Data Supplement (pages E2-E3). In more detail these include:

◆ The list of indications for spirometry (page e73, table 1) was updated primarily with changes in language.

  • “To measure the effect of disease on pulmonary function” was updated to “To measure the physiological effect of disease or disorder”
  • “To describe the course of diseases that affect lung function” was updated to “To monitor disease progression”
  • “To monitor people exposed to injurious agents” was updated to “To monitor people for adverse effects of exposure to injurious agents”

◆ Items added to indications:

  • “Research and clinical trials”
  • “Preemployment and lung health monitoring for at-risk occupations”

◆ Contraindications were previously mentioned in the 2005 General Considerations rather than the 2005 Spirometry Standards and these have been extensively updated and expanded. Although the list of contraindications (page e74, table 2) is fairly inclusive (and should be reviewed by all concerned) there were items mentioned in the body of text that were not in the table:

  • “Spirometry should be discontinued if the patient experiences pain during the maneuver.”
  • “…because spirometry requires the active participation of the patient, inability to understand directions or unwillingness to follow the directions of the operator will usually lead to submaximal test results.”

◆ Notably, abdominal aortic aneurysm (AAA) was not included as a contraindication in the 2019 standards. (page e72, column 3, paragraph 1)

Continue reading

CPET Test Interpretation, Part 2: Gas Exchange

I would like to re-iterate the importance of the descriptive part of CPET interpretation. At the very least consider it to be a checklist that should always be reviewed even when you think you know what the final interpretation is going to be.

After ventilation, the next step in the flow of gases is gas exchange. The descriptive elements for assessing gas exchange are:

What was the maximum oxygen consumption (VO2)?

The maximum oxygen consumption is the prime indicator of exercise capacity. Predicted values should be based on patient height, age, weight and gender.

Note: There is actually a surprising limited number of reference equations for maximum VO2. The only one I’ve found that takes weight into consideration in a realistic manner is Wasserman’s algorithm. Some test systems do not offer this reference equation but I feel it is worthwhile for it to be calculated and used regardless. See appendix for the algorithm.

Note: The maximum VO2 does not necessarily occur at peak exercise (i.e. test termination). This can happen in various types of cardiac and vascular diseases but also because the patient may decrease the level of their exercise before the test is terminated.

  • Maximum VO2 > 120% of predicted = Elevated
  • Maximum VO2 = 80% to 119% of predicted = Normal
  • Maximum VO2 = 60% to 79% of predicted = Mild impairment
  • Maximum VO2 = 40% to 59% of predicted = Moderate impairment
  • Maximum VO2 < 40% of predicted = Severe impairment

Example: The maximum VO2 was X.XX LPM { which is {mildly | moderately | severely } decreased | within normal limits | elevated}.

Continue reading

CPET Test Interpretation, Part 1: Ventilatory response

I’ve always found interpreting CPET tests to be one of the more interesting (and enjoyable) things I’ve done. Interpreting a CPET test is both more difficult and easier than interpreting regular PFTs. More difficult because there are a lot more parameters involved and easier because determining test adequacy and the primary cause(s) of an exercise limitation tends to be clearer.

I’ve found that you have to go back to basic physiology whenever you interpret CPETs and that always boils down to the flow of oxygen and carbon dioxide.

Abnormalities in gas flow that occurs at any of these steps will leave a distinctive pattern in the test results. I’ve developed a structured approach to interpreting CPET results that includes a descriptive part as well as the interpretation and summary. The descriptive part may appear to be tedious but I’ve always found it to be absolutely critical to the actual interpretation.

The descriptive elements for assessing the ventilatory response to exercise are:

What was the baseline spirometry?

Note: Spirometry pre- and post-exercise should always be performed as part of a CPET, even when exercise-induced bronchoconstriction is not suspected. This is so that normal values for the ventilatory response to exercise can be determined.

Example: The FVC was {normal | mildly reduced | moderately reduced | moderately severely reduced | very severely reduced}. The FEV1 was {normal | mildly reduced | moderately reduced | moderately severely reduced | very severely reduced}. The FEV1/FVC ratio was was {normal | mildly reduced | moderately reduced | severely reduced}.

What was the post-exercise change in FEV1?

A decrease in FEV1 ≧ 15% following exercise is abnormal and suggests exercise-induced bronchoconstriction.

Note: FEV1 can increase post-exercise and an increase up to 5% is normal. Some patients with reactive airway disease bronchodilate with exercise and can an increase ≧ 15% from baseline, particularly if they were obstructed to begin with. Although strictly speaking this is not abnormal, it does suggest the presence of labile airways.

Example: There was {a significant decrease / no significant change / a significant increase} in FEV1 following exercise.

Continue reading

FEV1 and VC should be measured separately

The FEV1 and VC both provide quite different information about a patient’s lungs. Unfortunately, spirometry as it is currently practiced is optimized towards generating an accurate FEV1 more than an accurate VC. This is partly due to limitations in the maneuver itself and partly due to the lack of accurate end-of-test criteria for an adequate VC. In one sense this is okay since more than one person that I’ve known and respected has said that “it’s all about the FEV1”.

Having said that, an accurate FEV1/VC ratio is essential for detecting and quantifying airway obstruction and an SVC maneuver is more likely to obtain a more accurate VC. This matters because the current ATS/ERS spirometry guidelines recommend that the FEV1/VC be reported, where the VC is the largest value obtained from any test and reference equations indicate that the SVC is routinely larger than the FVC:

So, shouldn’t we be routinely performing both FVC and SVC maneuvers when we do spirometry on our patients? And why aren’t we?

Continue reading

A modest proposal for a clinical spirometry grading system

A while back I reviewed the spirometry grading system that was included in the 2017 ATS reporting standards. My feeling was, and continues to be, that its usefulness is very limited because it’s mostly a reproducibility grading system that relies on a few easy-to-measure parameters. This doesn’t mean that a grading system can’t be helpful, just that it needs to be focused differently.

In a clinical PFT lab many patients have difficulty performing adequate and reproducible spirometry, but that doesn’t mean the results aren’t clinically useful. Moreover, suboptimal quality results may be the very best the patient is ever able to produce. So what’s more important in a grading system than reproducibility is the ability to assess the clinical utility of a reported spirometry effort.

The two most important results that come from spirometry are the FEV1 and the FVC, and I strongly believe that they need to be assessed separately. For each of these values there are two aspects that need to be determined. First, is there a reliable probability that the reported value is correct? Second, are any errors causing the reported value to be underestimated or overestimated? The two are inter-related since a value with excellent reliability is not going to have any significant errors, but if there are errors then a reviewer needs to know which direction the result is being biased.

The current ATS/ERS standards contain specific thresholds for certain spirometry values such as expiratory time and back-extrapolation. Although these are certainly indications of test quality they are almost always used in a binary [pass | fail] manner. In order to assess clinical usefulness however, you instead need to grade these on a scale. For example an expiratory time of 5.9 seconds for spirometry from a 60 year-old individual would mean that there is a small probability that the FVC is underestimated, but with an expiratory time of 1.9 seconds the FVC would have a very high probability of being underestimated and this needs to be recognized in order to assess clinical utility.

Note: Although the A-B-C-D-F grading system is rather prosaic it is still universally understandable, so I will use it for grading reliability. An A grade or an F grade are probably easy to assign but differentiating between B-C-D may be more subjective, particularly since reliability depends on multiple parameters and judging their relative contribution is always going to be subjective at some point. For bias, I will be using directional characters (↑↓) to show the direction of the bias (i.e. positive or negative), so ↑ will indicate probable overestimation, ↓ will indicate probable underestimation, and ~ indicates a neutral bias.

FEV1 / Back extrapolation:

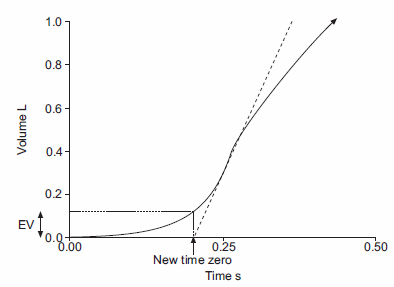
Back-extrapolation is a way to assess the quality of the start of a spirometry effort and the accuracy of the timing of the FEV1. The ATS/ERS statement says that the back-extrapolated volume must be less that 5% of the FVC or less than 0.150 L, whichever is greater.

My experience is that an elevated back-extrapolation tends to cause FEV1 to be overestimated far more often than underestimated. So a suggested grading system for back-extrapolation would be (and I’ll be the first to admit these are off the top of my head and open for discussion):

FEV1:    
Back-Extrapolation: Reliability: Bias:
Within standards: A ~
> 1 x standard, < 1.5 x standard: B
> 1.5 x standard, < 2 x standard C ↑↑
> 2 x standard, < 2.5 x standard: D ↑↑↑
> 2.5 x standard F ↑↑↑↑

Continue reading

Is gas trapping more common than we think it is?

Over the last couple of years I’ve run across a number of test systems that do not include tidal loops along with the maximal flow-volume loop. I’ve wondered why this was done and because of this I’ve thought a lot about tidal flow-volume loops and what additional information, if any, they add to spirometry interpretation.

One of my thoughts has been about the relationship between obesity and the IC and ERV. FVC and TLC are often reasonably preserved even with relatively severe obesity. FRC, on the other hand, is often noticeably affected with even minor changes in BMI (and interestingly this applies to reduced as well as elevated BMI’s). When FRC decreases because of obesity the IC usually increases and the ERV decreases and for this reason the IC/ERV ratio has been suggested as a way to monitor changes in FRC without having to actually measure lung volumes.

IC and ERV are not measured as part of spirometry but the position of the tidal loops gives at least a general indication of their magnitude and I’ve noticed that there’s a moderately good correlation between BMI and the position of the tidal loop.

With this in mind, I see up to a dozen reports a week with restrictive-looking spirometry (i.e. symmetrically reduced FVC and FEV1 with a normal FEV1/FVC ratio) on patients with a diagnosis of asthma. This is nothing new and there have probably been at least 10 articles in the last decade about the Restrictive Spirometry Pattern (RSP). Interpreting these kinds of spirometry results is always problematic, particularly when there are no prior lung volume measurements to rule-in or rule-out restriction. I’ve noticed however, that patients with a restrictive spirometry pattern almost always have the tidal loop on the far right-hand side of the flow-volume loop (zero or near zero ERV). For example:

Observed: %Predicted:
FVC: 1.65 74
FEV1: 1.21 73
FEV1/FVC: 73 100

But there doesn’t seem to be any relationship between this observation and the patient’s BMI and in fact, this is seen even when BMI is normal or somewhat reduced. Continue reading

Telling the right story

The 2005 ATS/ERS spirometry standard make it permissible and even recommends that the FVC and FEV1 be selected from different efforts. I disagree somewhat with their criteria for selecting the FEV1 but overall reporting composite results makes a lot of sense. In an ideal world we’d always get the best FVC and FEV1 in a single effort but what we more often get is a good FEV1 with a poor FVC or a poor FEV1 with a good FVC. So, it best serves the clinical needs of the patient to report the best elements from multiple spirometry efforts.

However, I was disappointed that the 2017 ATS reporting standards did not in any way address how to indicate that composite results are being reported, nor does it resolve the selection of the flow-volume loops and volume-time curves that accompany the numerical results. That leaves it to us to decide how to do this but this in turn is often limited by the capabilities of our equipment’s software.

One test system that I routinely take to a free spirometry screening clinic will only report the three “best” efforts based solely on the largest combined FVC + FEV1. Admittedly, to some extent this follows the 2005 ATS/ERS spirometry standards selection criteria but other than deleting a specific test effort I cannot override these selections nor can I mix and match the FVC and FEV1 values. This means that what it reports as the “best” effort doesn’t always agree with what in reality are the best results.

My lab’s software however, allows us to select which test efforts the FVC and FEV1 come from. In addition we can select which test effort the ancillary measurements (Peak Flow, Expiratory Time, FIVC, FEF50, etc.) and which effort the flow-volume loop and volume-time graphs comes from.

It is therefore possible to select the FVC, FEV1, ancillary measurements and the graphs from entirely different test efforts. Thankfully, this almost never done but when I review reports what I see most frequently is that the FVC is selected from one test effort, but the FEV1, ancillary measurements and graphs are selected from another. To some extent this makes sense because I’d usually agree that the Peak Flow should always be associated with the FEV1, and if that’s the case, then so should the flow-volume loop. The problem with this is that the FVC often comes from a test effort with a substantially longer expiratory time and when results are selected this the volume-time curve and expiratory time are instead reported for the effort the FEV1 came from.

This leads to a report that look like this:

Observed: Predicted: %Predicted:
FVC: 2.62 3.65 72%
FEV1: 2.01 2.58 78%
FEV1/FVC: 77 72 107%
Peak Flow: 8.83 6.73 131%
Exp. Time: 1.20

with graphs like:

Continue reading

I’ve got the old back-extrapolation blues

A couple days ago I pulled my copy of the Intermountain Thoracic Society manual on pulmonary function testing off the bookshelf and thumbed through it a bit. It was first published in 1975 and was the first major attempt towards standardizing the performance and interpretation of PFTs.

My first thought was that we’ve come a long way since then. Most importantly our understanding of what spirometry can (and cannot) tell us has improved dramatically.

Equipment too, has advanced since 1975, most particularly due to the first equipment standards that were published in that decade. As a reminder, spirometer accuracy was not a given and there are number of studies dating from that time period that detailed just how woefully inaccurate many of them were.

In 1975 computerized spirometers were exceptionally rare and I was reminded of this because 141 pages (two-thirds!) of the ITS manual is filled with look-up tables for predicted values and ATPS – BTPS – STPD conversion factors.

Most spirometry systems were entirely manual and the majority of us measured FVC and FEV1 manually from pen tracings on kymograph paper. The results were then hand-calculated and then hand-written onto report forms. Since our equipment is so much more accurate and our computers acquire and calculate test results automatically, everything is so much better now, isn’t it?

Overall, I’d have to say yes. Testing is much quicker and more accurate than it used to be in 1975, and no, I’m not particularly nostalgic about those days.

{Arrrhh, gather round lads and lasses and let me tell you of the days when coal-fired steam-powered spirometers rumbled and hissed in basement labs everywhere; when you had to solve regression equations with your slide rule on the fly or risk the horror of ripped kymograph paper, exploding alveolar sample bags and spirometer bells gone ballistic without warning. The toll this daily physical and mental trauma took amongst the lowly pulmonary techs was terrifying and only the bravest continued the daily battle against gnarly patients, sneering doctors, black-hearted administrators and monopolistic manufacturers…

…Oops! Wrong time-line; those are memories from the universe one north and two left of ours. Too much steampunk sci-fi late at night and too little sleep left me momentarily confused}

I ran across an error today that reminded me that although computerized test systems are essential to our ability to run efficient and accurate labs, at the same time the limitations of software that comes along with them hinders our ability to detect and correct errors.

Continue reading

A spirometry quality grading system. Or is it?

A set of guidelines for grading spirometry quality was included with the recently published ATS recommendations for a standardized pulmonary function report. These guideline are similar to others published previously so they weren’t a great surprise but as much as I may respect the authors of the standard my first thought was “when was the last time any of these people performed routine spirometry?” The authors acknowledge that the source for these guidelines is epidemiological and if I was conducting a research study that required spirometry these guidelines would be useful towards knowing which results to keep and which to toss but for routine clinical spirometry, they’re pretty useless.

I put these thoughts aside because I had other projects I was working on but I was reminded of them when I recently performed spirometry on an individual who wasn’t able to perform a single effort without a major errors. The person in question was an otherwise intelligent and mature individual but found themselves getting more frustrated and angry with each effort because they couldn’t manage to perform the test right. I did my best to explain and demonstrate what they were supposed to do each time but after the third try they refused to do any more. About the only thing that was reportable was the FEV1 from a single effort.

This may be a somewhat extreme case but it’s something that those of us who perform PFTs are faced with every day. There are many individuals that have no problems performing spirometry but sometimes we’re fortunate to get even a single test effort that meets all of the ATS/ERS criteria. The presence or absence of test quality usually isn’t apparent in the final report however, and for this reason I do understand the value in some kind of quality grading system. But that also implies that the grading system serves the purpose for which it is intended.

In order to quantify this I reviewed the spirometry performed by 200 patients in my lab in order to determine how many acceptable and reproducible results there were. To be honest, as bad as I thought the quality problem was, when I looked at the numbers it was worse than I imagined.

The spirometry quality grading system is:

Grade: Criteria:
A ≥3 acceptable tests with repeatability within 0.150 L (for age 2–6, 0.100 L ), or 10% of highest value, whichever is greater
B ≥2 acceptable tests with repeatability within 0.150 L (for age 2–6, 0.100 L ), or 10% of highest value, whichever is greater
C ≥2 acceptable tests with repeatability within 0.200 L (for age 2–6, 0.150 L ), or 10% of highest value, whichever is greater
D ≥2 acceptable tests with repeatability within 0.250 L (for age 2–6, 0.200 L ), or 10% of highest value, whichever is greater
E 1 acceptable test
F No acceptable tests

Continue reading