2019 ATS/ERS Spirometry Standards

The 2019 ATS/ERS Spirometry Standards were recently released. The standards are open-access and can be downloaded without charge from the October 15th issue of the American Journal of Respiratory and Critical Care Medicine. Supplements are available from the same web page.

The 2019 Spirometry Standards have been extensively re-organized with numerous updates. Notably, a number of sections that were previously discussed in the 2005 General Considerations for Lung Function Testing have been updated and included in the 2019 Spirometry Standards. Also notably, a number of stand-alone spirometry tests, including the Flow-Volume Loop, PEF and MVV are not included in the 2019 Standards.

An overview of changes and updates from the 2005 Spirometry Standards are detailed within the 2019 Spirometry Standards (page e71, column 1, paragraph 2) and in the Data Supplement (pages E2-E3). In more detail these include:

◆ The list of indications for spirometry (page e73, table 1) was updated primarily with changes in language.

  • “To measure the effect of disease on pulmonary function” was updated to “To measure the physiological effect of disease or disorder”
  • “To describe the course of diseases that affect lung function” was updated to “To monitor disease progression”
  • “To monitor people exposed to injurious agents” was updated to “To monitor people for adverse effects of exposure to injurious agents”

◆ Items added to indications:

  • “Research and clinical trials”
  • “Preemployment and lung health monitoring for at-risk occupations”

◆ Contraindications were previously mentioned in the 2005 General Considerations rather than the 2005 Spirometry Standards and these have been extensively updated and expanded. Although the list of contraindications (page e74, table 2) is fairly inclusive (and should be reviewed by all concerned) there were items mentioned in the body of text that were not in the table:

  • “Spirometry should be discontinued if the patient experiences pain during the maneuver.”
  • “…because spirometry requires the active participation of the patient, inability to understand directions or unwillingness to follow the directions of the operator will usually lead to submaximal test results.”

◆ Notably, abdominal aortic aneurysm (AAA) was not included as a contraindication in the 2019 standards. (page e72, column 3, paragraph 1)

Continue reading
CPET Test Interpretation, Part 3: Circulation

I would like to re-emphasize the importance of the descriptive part of CPET interpretation. At the very least consider it to be a checklist that should always be reviewed even when you think you know what the final interpretation is going to be.

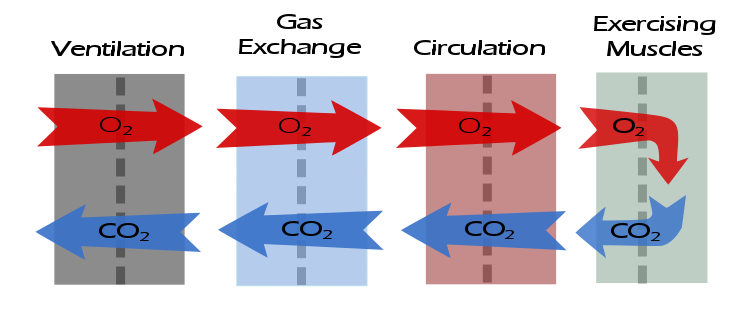
After gas exchange, the next step in the flow of gases is circulation. The descriptive elements for assessing circulation are:

What was the maximum heart rate?

The maximum predicted heart rate is calculated from 220 – age.

A maximum heart rate above 85% of predicted indicates that there has been an adequate exercise test effort.

Example: The maximum heart rate was XX% of predicted {which indicates an adequate test effort}.

What was the heart rate reserve?

The heart rate reserve is (predicted heart rate – maximum heart rate). A heart rate reserve that is greater than 20% of the (predicted heart rate – resting heart rate) is elevated and may be an indication of either chronotropic incompetence or an inadequate test effort.

Note: A negative heart rate reserve will occur whenever a patient exceeds their predicted heart rate.

Example: The heart rate reserve is XX BPM which is {within normal limits | elevated}.

Continue reading

Telling the right story

The 2005 ATS/ERS spirometry standard make it permissible and even recommends that the FVC and FEV1 be selected from different efforts. I disagree somewhat with their criteria for selecting the FEV1 but overall reporting composite results makes a lot of sense. In an ideal world we’d always get the best FVC and FEV1 in a single effort but what we more often get is a good FEV1 with a poor FVC or a poor FEV1 with a good FVC. So, it best serves the clinical needs of the patient to report the best elements from multiple spirometry efforts.

However, I was disappointed that the 2017 ATS reporting standards did not in any way address how to indicate that composite results are being reported, nor does it resolve the selection of the flow-volume loops and volume-time curves that accompany the numerical results. That leaves it to us to decide how to do this but this in turn is often limited by the capabilities of our equipment’s software.

One test system that I routinely take to a free spirometry screening clinic will only report the three “best” efforts based solely on the largest combined FVC + FEV1. Admittedly, to some extent this follows the 2005 ATS/ERS spirometry standards selection criteria but other than deleting a specific test effort I cannot override these selections nor can I mix and match the FVC and FEV1 values. This means that what it reports as the “best” effort doesn’t always agree with what in reality are the best results.

My lab’s software however, allows us to select which test efforts the FVC and FEV1 come from. In addition we can select which test effort the ancillary measurements (Peak Flow, Expiratory Time, FIVC, FEF50, etc.) and which effort the flow-volume loop and volume-time graphs comes from.

It is therefore possible to select the FVC, FEV1, ancillary measurements and the graphs from entirely different test efforts. Thankfully, this almost never done but when I review reports what I see most frequently is that the FVC is selected from one test effort, but the FEV1, ancillary measurements and graphs are selected from another. To some extent this makes sense because I’d usually agree that the Peak Flow should always be associated with the FEV1, and if that’s the case, then so should the flow-volume loop. The problem with this is that the FVC often comes from a test effort with a substantially longer expiratory time and when results are selected this the volume-time curve and expiratory time are instead reported for the effort the FEV1 came from.

This leads to a report that look like this:

Observed: Predicted: %Predicted:
FVC: 2.62 3.65 72%
FEV1: 2.01 2.58 78%
FEV1/FVC: 77 72 107%
Peak Flow: 8.83 6.73 131%
Exp. Time: 1.20

with graphs like:

Continue reading

A spirometry quality grading system. Or is it?

A set of guidelines for grading spirometry quality was included with the recently published ATS recommendations for a standardized pulmonary function report. These guideline are similar to others published previously so they weren’t a great surprise but as much as I may respect the authors of the standard my first thought was “when was the last time any of these people performed routine spirometry?” The authors acknowledge that the source for these guidelines is epidemiological and if I was conducting a research study that required spirometry these guidelines would be useful towards knowing which results to keep and which to toss but for routine clinical spirometry, they’re pretty useless.

I put these thoughts aside because I had other projects I was working on but I was reminded of them when I recently performed spirometry on an individual who wasn’t able to perform a single effort without a major errors. The person in question was an otherwise intelligent and mature individual but found themselves getting more frustrated and angry with each effort because they couldn’t manage to perform the test right. I did my best to explain and demonstrate what they were supposed to do each time but after the third try they refused to do any more. About the only thing that was reportable was the FEV1 from a single effort.

This may be a somewhat extreme case but it’s something that those of us who perform PFTs are faced with every day. There are many individuals that have no problems performing spirometry but sometimes we’re fortunate to get even a single test effort that meets all of the ATS/ERS criteria. The presence or absence of test quality usually isn’t apparent in the final report however, and for this reason I do understand the value in some kind of quality grading system. But that also implies that the grading system serves the purpose for which it is intended.

In order to quantify this I reviewed the spirometry performed by 200 patients in my lab in order to determine how many acceptable and reproducible results there were. To be honest, as bad as I thought the quality problem was, when I looked at the numbers it was worse than I imagined.

The spirometry quality grading system is:

Grade: Criteria:
A ≥3 acceptable tests with repeatability within 0.150 L (for age 2–6, 0.100 L ), or 10% of highest value, whichever is greater
B ≥2 acceptable tests with repeatability within 0.150 L (for age 2–6, 0.100 L ), or 10% of highest value, whichever is greater
C ≥2 acceptable tests with repeatability within 0.200 L (for age 2–6, 0.150 L ), or 10% of highest value, whichever is greater
D ≥2 acceptable tests with repeatability within 0.250 L (for age 2–6, 0.200 L ), or 10% of highest value, whichever is greater
E 1 acceptable test
F No acceptable tests

Continue reading

Thinking about the past

This is the time of the year when it’s traditional to review the past. That’s what “Auld lang syne”, the song most associated with New Year’s celebrations, is all about. I too have been thinking about the past but it’s not been about absent friends, it’s been about trend reports and assessing trends.

In the May 2017 issue of Chest, Quanjer et al reported their study on the post-bronchodilator response in FEV1. I’ve discussed this previously and they noted that the current ATS/ERS standard for a significant post-bronchodilator change of ≥12% and ≥200 ml penalized the short and the elderly. Their finding was that a significant change was better assessed by the absolute change in percent predicted (i.e. 8%) rather than a relative change.

I’ve thought about how this could apply to assessing changes in trends ever since then. The current standards for a significant change in FEV1 over time (also discussed previously) is anything greater than:

which is good in that it is a way to reference changes over any arbitrary time period but it also looks at it as a relative change (i.e. ±15%). A 15% change however, comes from occupational spirometry, not clinical spirometry, and the presumption, to me at least, is that it’s geared towards individuals who have more-or-less normal spirometry to begin with.

A ±15% change may make sense if your FEV1 is already near 100% of predicted but there are some problems with this for individuals who aren’t. For example, a 75 year-old 175 cm Caucasian male would have a predicted FEV1 of 2.93 L from the NHANESIII reference equations. If this individual had severe COPD and an FEV1 of 0.50 L (17% of predicted), then a ±15% relative change in FEV1 would ±0.075 L (75 ml). That amount of change is half the acceptable amount of intrasession repeatability (150 ml) in spirometry testing and it’s hard to consider a change this small as anything but chance or noise. It’s also hard to consider this a clinically significant change. Continue reading

2017 ATS PFT Reporting Standardization

The ATS has released its first standard for reporting pulmonary function results. This report is in the December 1, 2017 issue of the American Journal of Respiratory and Critical Care Medicine. At the present time however, despite its importance it is not an open access article and you must either be a member of the ATS or pay a fee ($25) in order to access it. Hopefully, it will soon be included with the other open access ATS/ERS standards.

There are a number of interesting recommendations made in the standard that supersede or refine recommendations made in prior ATS/ERS standards, or are otherwise presented for the first time. Specific recommendations include (although not necessarily in the order they were discussed within the standard):

  • The lower limit of normal, where available, should be reported for all test results.
  • The Z-score, where available, should be reported for all test results. A linear graphical display for this is recommended for spirometry and DLCO results.
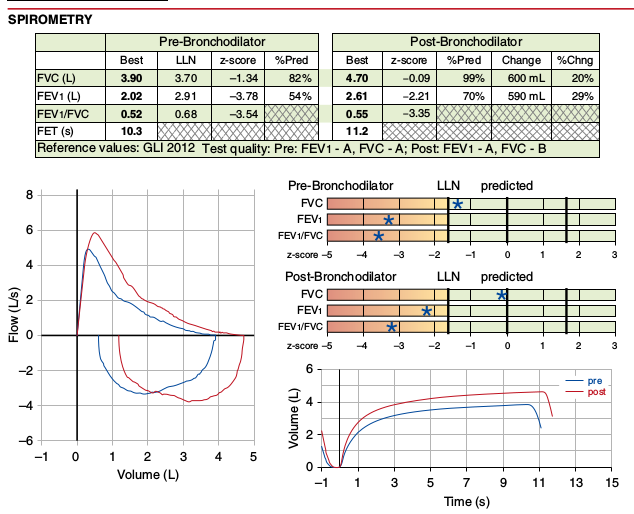
  • Results should be reported in tables, with individual results in rows. The result’s numerical value, LLN, Z-score and percent predicted are reported in columns, in that recommended order. Reporting the predicted value is discouraged.

Part of Figure 1 from page 1466 of the ATS Recommendations for a Standardized Pulmonary Function Report.

Continue reading

What do you do when the predicted is zero?

A very strange spirometry report came across my desk a couple of days ago.

Observed: Predicted: %Predicted:
FVC: 3.07 0 29767
FEV1: 2.15 0 37586
FEV1/FVC: 70 71 101%

My first thought was that some of the demographics information had been entered incorrectly but when I checked the patient’s age, height, gender and race all were present, all were reasonably within the normal range for human beings in general and more importantly, all agreed with what was in the hospital’s database for the patient. I tried changing the patient’s height, age, race and gender to see if it would make a difference and although this made small changes in the percent predicted when I did this the predicteds were still zero.

Or were they? They actually couldn’t have been zero, regardless of what was showing up on the report, since the observed test values are divided by the predicted values and if the predicted were really zero, then we’d have gotten a “divide by zero” error, and that wasn’t happening. Instead the predicted values had to be very close to zero, but not actually zero, and the software was rounding the value down to zero for the report. Simple math showed me the predicted value for FVC was (very) approximately 0.0103 liters, but why was this happening?

Continue reading

Why DIY CPET reports?

When I first started performing CPETs in the 1970’s a patient’s exhaled gas was collected at intervals during the test in Douglas bags and I had a worksheet that I’d use to record the patient’s respiratory rate, heart rate and SaO2. After the test was over I’d analyze the gas concentrations with a mass spectrometer and the gas volumes with a 300 liter Tissot spirometer and then use the results from these to hand calculate VO2, VCO2, Rq, tidal volume and minute volume. These results were then passed on to the lab’s medical director who’d use them when dictating a report.

Around 1990 the PFT lab I was in at the time acquired a metabolic cart for CPET testing. This both decreased the amount of work I had to do to perform a CPET and significantly increased the amount of information we got from a test. The reporting software that came with the metabolic cart however, was very simplistic and neither the lab’s medical director or I felt it met our needs so I created a word processing template, manually transcribed the results from the CPET system printouts and used it to report results.

Twenty five years and 3 metabolic carts later I’m still using a word processing template to report CPET results.

Why?

Well, first the reporting software is still simplistic and using it we still can’t get a report that we think meets our needs (and it’s also not easy to create and modify reports which is a chronic complaint I have about all PFT lab software I’ve ever worked with). Second, there are some values that we think are important that the CPET system’s reporting software does not calculate and there is no easy way to get it on a report as part of the tabular results. Finally, and most importantly, I need to check the results for accuracy.

You’d think that after all these years that you wouldn’t need to check PFT and CPET reports for mathematical errors but unfortunately that’s not true. For example, these results are taken from a recent CPET:

Time: VO2 (LPM): VCO2 (LPM): Reported Rq: “Real” Rq:
Baseline: 0.296 0.220 0.74 0.74
00:30 0.302 0.214 0.77 0.71
01:00 0.363 0.277 0.77 0.76
01:30 0.395 0.306 0.78 0.77
02:00 0.424 0.353 0.99 0.83
02:30 0.459 0.403 0.92 0.88
03:00 0.675 0.594 0.89 0.88
03:30 0.618 0.584 0.94 0.94
04:00 0.836 0.822 1.00 0.98

Continue reading

It doesn’t make any sense

For a variety of reasons my wife recently had a full panel of PFTs (spiro+BD, lung volumes, DLCO) at a different hospital than the one I work at. I went with her and was pleased to see the technician perform the tests pleasantly, competently and thoroughly. I was able to glance at the results as the testing proceeded so I had a fairly good idea what the overall picture looked like by the time she was done.

The difficulty came later when my wife asked me to print out her results so we could go over them together. Many hospitals and medical centers have websites that let patients email their doctor, review their appointments and access their medical test results. They go by a variety of names such as MyChart, MyHealth, Patient Gateway, PatientSite, PatientConnect etc., etc. My hospital first implemented something like this over a dozen years ago so I had thought that by now they were fairly universal but conversations with a couple of friends from around the country have let me know that this isn’t really the case.

Regardless of this, the hospital where my wife had her PFTs does have a website for patients and her PFT results showed up about a week later. When I went to look at them however, I was completely taken aback. Not because the results were wrong but because they were presented in a way that made them incredibly difficult to read and understand.

Here’s the report (and yes, this is exactly what it looked like on the patient website):

Continue reading

A real fixer-upper

I was reviewing reports today when I ran across one with some glaring errors. There were several things that immediately told me that the reported plethysmographic lung volumes were way off; the VA from the DLCO was almost a liter and a half larger than the TLC and the SVC was only about half the volume of the FVC.

Table1

When I took a look at the raw test data I saw at least part of the reason why the technician had selected these results to be reported and that was because the SVC quality from most of the efforts was poor. They mostly looked like this:

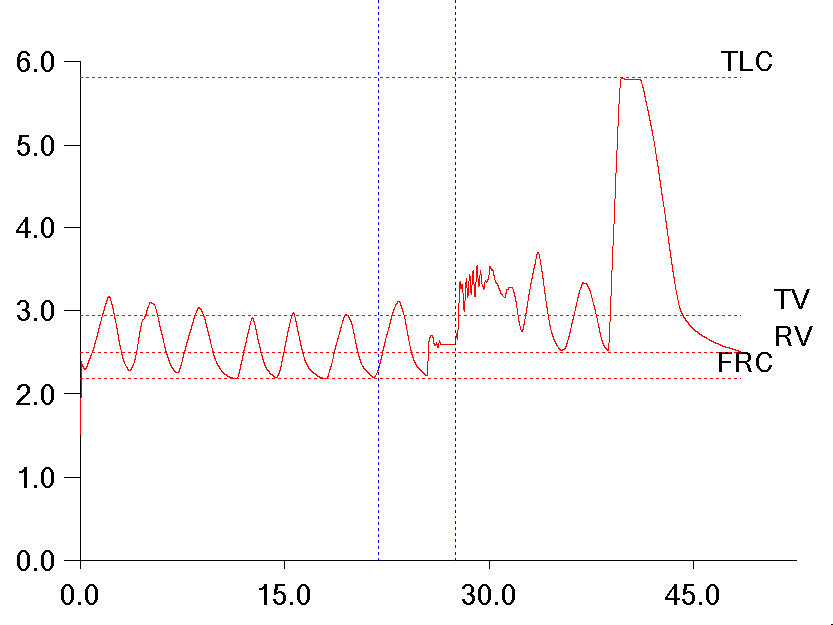
Fixer_Upper_01

It is apparent that the patient leaked while panting against the closed shutter and this caused the FRC baseline to shift upwards. I’ve discussed this problem previously, but when this happens the RV is larger than the FRC, there is a negative ERV and the TLC is overestimated. There is no way to fix this problem from within the software. The FRC is determined by the tidal breathing before the shutter closes and cannot be re-measured afterward.

Continue reading