2019 ATS/ERS Spirometry Standards

The 2019 ATS/ERS Spirometry Standards were recently released. The standards are open-access and can be downloaded without charge from the October 15th issue of the American Journal of Respiratory and Critical Care Medicine. Supplements are available from the same web page.

The 2019 Spirometry Standards have been extensively re-organized with numerous updates. Notably, a number of sections that were previously discussed in the 2005 General Considerations for Lung Function Testing have been updated and included in the 2019 Spirometry Standards. Also notably, a number of stand-alone spirometry tests, including the Flow-Volume Loop, PEF and MVV are not included in the 2019 Standards.

An overview of changes and updates from the 2005 Spirometry Standards are detailed within the 2019 Spirometry Standards (page e71, column 1, paragraph 2) and in the Data Supplement (pages E2-E3). In more detail these include:

◆ The list of indications for spirometry (page e73, table 1) was updated primarily with changes in language.

  • “To measure the effect of disease on pulmonary function” was updated to “To measure the physiological effect of disease or disorder”
  • “To describe the course of diseases that affect lung function” was updated to “To monitor disease progression”
  • “To monitor people exposed to injurious agents” was updated to “To monitor people for adverse effects of exposure to injurious agents”

◆ Items added to indications:

  • “Research and clinical trials”
  • “Preemployment and lung health monitoring for at-risk occupations”

◆ Contraindications were previously mentioned in the 2005 General Considerations rather than the 2005 Spirometry Standards and these have been extensively updated and expanded. Although the list of contraindications (page e74, table 2) is fairly inclusive (and should be reviewed by all concerned) there were items mentioned in the body of text that were not in the table:

  • “Spirometry should be discontinued if the patient experiences pain during the maneuver.”
  • “…because spirometry requires the active participation of the patient, inability to understand directions or unwillingness to follow the directions of the operator will usually lead to submaximal test results.”

◆ Notably, abdominal aortic aneurysm (AAA) was not included as a contraindication in the 2019 standards. (page e72, column 3, paragraph 1)

Continue reading
What’s normal about airway resistance?

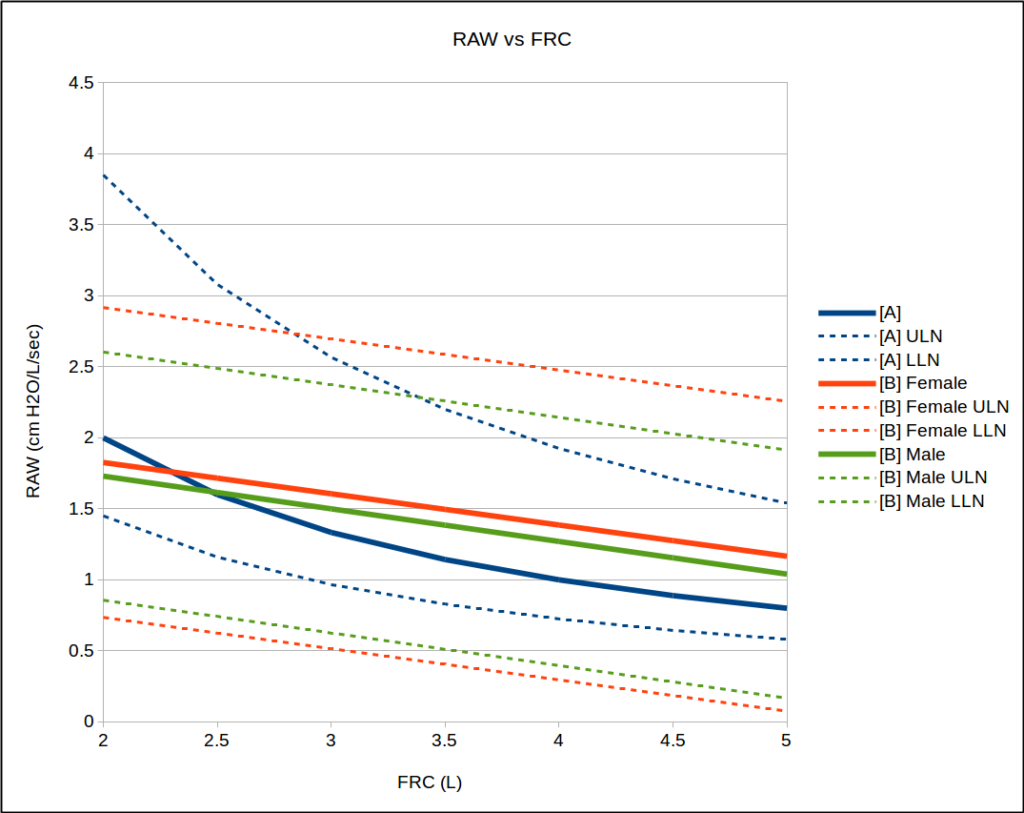
The question that was actually posed to me a month or so ago was “when is RAW abnormal?” I didn’t have a good answer at the time since airway resistance (RAW) tests are not performed by my lab. The pulmonary physicians I work with don’t think that RAW is a clinically useful measurement and for a variety of reasons I don’t disagree with this. Nevertheless, RAW testing is routinely performed in many labs around the world so I thought it would be interesting to spend some time researching this.

When asking what’s normal the first issue is which RAW value are you talking about? The measurement of airways resistance using a body plethysmograph was first described by DuBois et al in 1956. Airway resistance (RAW) is the amount of pressure required to generate a given flow rate and is reported in cm H2O/L/Sec. A number of physiologists quickly found that the reciprocal of RAW, conductance (GAW), which is expressed as the flow rate for a given driving pressure (L/sec/cm H2O), was also a useful way to describe the pressure-flow relationship of the airways.

For technical reasons TGV (Thoracic Gas Volume) must be measured at the same time as RAW. It was soon noted that there was a relationship between RAW and TGV and that airway resistance decreased as lung volume increased.

Continue reading

2017 ATS PFT Reporting Standardization

The ATS has released its first standard for reporting pulmonary function results. This report is in the December 1, 2017 issue of the American Journal of Respiratory and Critical Care Medicine. At the present time however, despite its importance it is not an open access article and you must either be a member of the ATS or pay a fee ($25) in order to access it. Hopefully, it will soon be included with the other open access ATS/ERS standards.

There are a number of interesting recommendations made in the standard that supersede or refine recommendations made in prior ATS/ERS standards, or are otherwise presented for the first time. Specific recommendations include (although not necessarily in the order they were discussed within the standard):

  • The lower limit of normal, where available, should be reported for all test results.
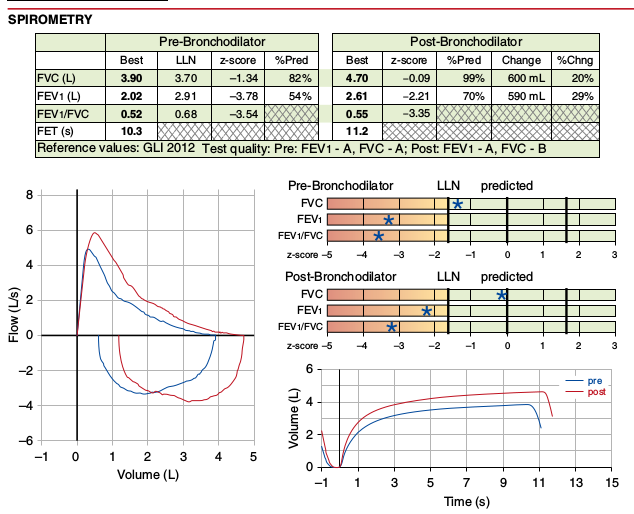
  • The Z-score, where available, should be reported for all test results. A linear graphical display for this is recommended for spirometry and DLCO results.
  • Results should be reported in tables, with individual results in rows. The result’s numerical value, LLN, Z-score and percent predicted are reported in columns, in that recommended order. Reporting the predicted value is discouraged.

Part of Figure 1 from page 1466 of the ATS Recommendations for a Standardized Pulmonary Function Report.

Continue reading

Why the FEV1/FVC ratio LLN as a percent of the predicted FEV1/FVC ratio is important

My medical director and I had a discussion today about where the cutoff for a normal FEV1/FVC ratio would be for a 93 year old patient of his. Part of the problem is that there are almost no reference equations for patients this age and the best you can usually do is to extrapolate. Another part is that anybody in their 90’s is a survivor and must have had good lung function throughout their life to reach that age, which means that they aren’t average so it’s not clear how well extrapolation actually works in this population. The final part is that the guidelines for PFT interpretation that are used by my lab were put into place about 40 years ago and reflect the thoughts at that time. I updated part of the guidelines with the 2005 ATS/ERS interpretation algorithm about 10 years ago, but the thresholds for normalcy (as well as the reference equations we use) still haven’t changed all that much. I’ve brought this issue up a number of times over the years (usually every time I get a new medical director) but haven’t gotten a consensus from the pulmonary physicians on either the need for change or for what threshold values should be used.

Anyway, both my medical director and I felt felt that the LLN for the FEV1/FVC ratio (when viewed as a percent of the predicted FEV1/FVC ratio) is probably lower for a 75 year old (and certainly for a 93 year old) than it is for a 25 year old, and that the current lab guidelines for interpretation were probably diagnosing airway obstruction in the elderly more often than they should. My lab currently uses the NHANESIII reference equations for spirometry however, and I wasn’t sure they showed this particularly well since the equations for the FEV1/FVC ratio and its LLN are quite simplistic compared to those for FVC and FEV1.

The NHANESIII reference equations were published in 1999 and at that time they were derived from the largest population that had ever been studied (7428 subjects, 40.9% male, 59.1% female) and with the most sophisticated statistical analysis that had been used up until that time. In 2012 however, the Global Lung Function Initiative (GLI) released a set of reference equations using data obtained from 73 centers world-wide on 97,759 subjects (44.7% male, 55.3% female). Statistical analysis of the GLI data was performed using the Lambda, Mu, Sigma (LMS) approach and a set of equations were derived that covered ages 3 to 95.

I have some reservations about how well the GLI equations match the population served by my lab but it’s a moot point whether I like them or not since even now, 5 years after the GLI equations were published, my lab’s software has not been updated to include them. The reason for this is that the GLI spirometry equations use what are called “splines” to generate the spirometry reference values and these are taken from a look-up table. My lab’s software does have an equation editor but it will not accommodate lookup tables so the GLI equations can’t be added. I’m sure our equipment manufacturer could get around this if they really wanted to, but so far it hasn’t happened.

I do have a lot of respect for the GLI equations however, and think that the overall view they give of the normal distribution of FVC, FEV1 and the FEV1/FVC ratio is far more correct than those of any prior studies. Using a spreadsheet tool downloaded from the GLI that lets me generate the GLI spirometry predicted values and the NHANESIII reference equations I decided to take a closer look at their predicted FEV1/FVC ratios and their LLNs.

Continue reading

What’s normal about the GLI DLCO reference values?

The Global Lung Initiative (GLI) has been working for several years to develop a universal reference equation for DLCO. Although this endeavor is not necessarily complete, an article describing the GLI DLCO reference equation for Caucasians was published in the September issue of the European Respiratory Journal as an open access article and can be downloaded by anyone. The Global Lung Initiative in general and the authors of the article more particularly are to be commended for this monumental work and for the insight it brings to understanding the normal distribution of DLCO.

The data used to develop the GLI reference equations was originally derived from 19 studies the GLI identified to have been performed on lifetime nonsmoking populations. 85% of the results came from Caucasian populations and the remaining from two Asian sources. The authors felt that there weren’t a sufficient number of non-Caucasians to accurately describe any ethnicity-based differences in DLCO and for this reason only the Caucasian data was used.

From this data some results were excluded because of:

  • FEV1 > 5 Z-scores or < 5 Z scores
  • Height (children only, >5 or <5 Z scores)
  • VA less than VC
  • Elevated BMI (>30 kg/m2 in adults, >85% centile in children)
  • Missing demographic information

After these exclusions 9710 results remained of which 4859 were male and 4851 were female. DLCO values were corrected for altitude and FiO2 and uncorrected for hemoglobin. Reference equations were derived using the LMS (Lambda, Mu, Sigma) method.

Note: The study population consisted of individuals from 4.5 to 91 years of age and GLI reference equations are valid across this entire span. The majority of the existing DLCO reference equations available to me are for an adult population and for this reason this discussion of the GLI DLCO reference equations will be limited to this portion of the age range. The GLI article also includes reference values for KCO and VA but these subjects will also be saved for a separate discussion.

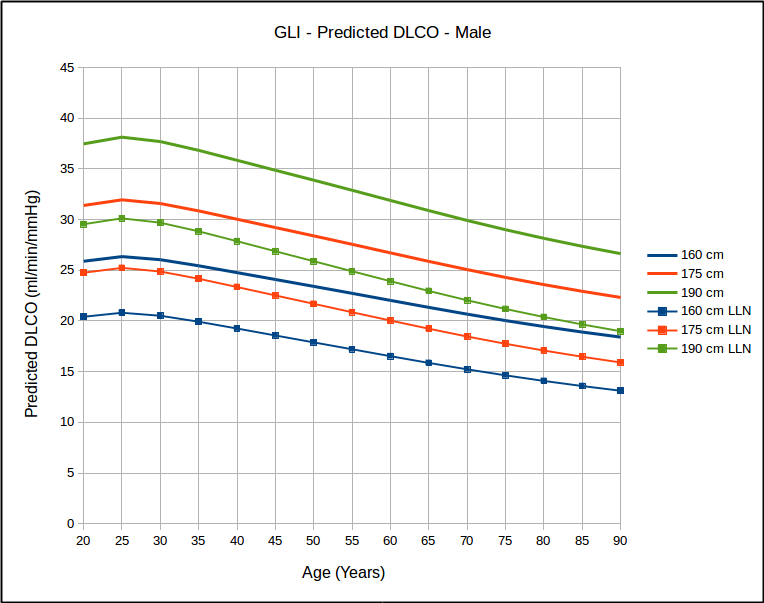
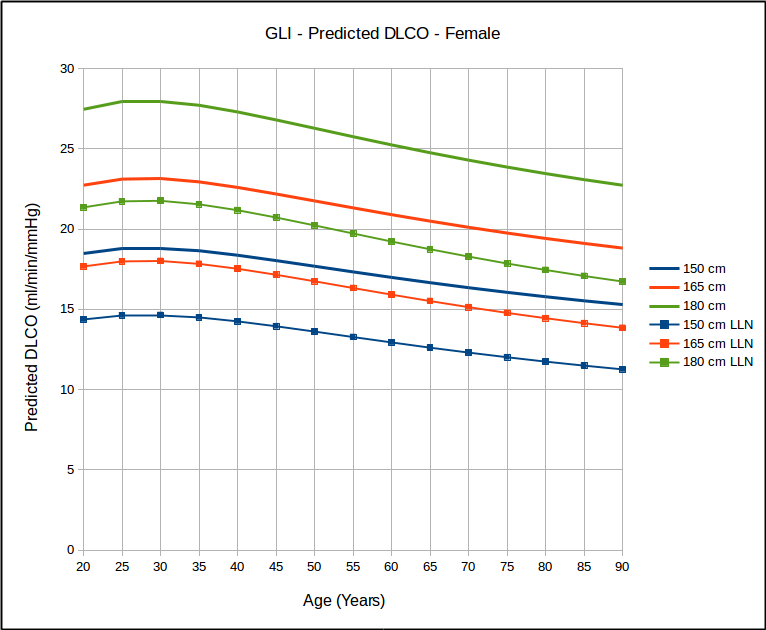
Not surprisingly, DLCO is highest in tall and young individuals, and lower in short and elderly ones.

Continue reading

Z Score to remember is -1.645

The use of Z scores to report PFT results, both clinically and for research is occurring more and more frequently. Both the Z score and the Lower Limit of Normal (LLN) come from the same roots and in that sense can be said to be saying much the same thing. The difference between the two however, is in the emphasis each places on how results are analyzed. The LLN primarily emphasizes only whether a result is normal or abnormal. The Z score is instead a description of how far a result is from the mean value and therefore emphasizes the probability that a result is normal or abnormal.

Reference equations are developed from population studies and the measurements that come from these studies almost always fall into what’s called a normal distribution (also known as a bell-shaped curve).

A normal distribution has two important properties: the mean value and the standard deviation. The mean value is essentially the average of the results while the standard deviation describes whether the distribution of results around the mean is narrow or broad.

The simple definition of the Z score for a particular result is that it is the number of standard deviations that a result is away from the mean. It is calculated as:

Continue reading

What do you do when the predicted is zero?

A very strange spirometry report came across my desk a couple of days ago.

Observed: Predicted: %Predicted:
FVC: 3.07 0 29767
FEV1: 2.15 0 37586
FEV1/FVC: 70 71 101%

My first thought was that some of the demographics information had been entered incorrectly but when I checked the patient’s age, height, gender and race all were present, all were reasonably within the normal range for human beings in general and more importantly, all agreed with what was in the hospital’s database for the patient. I tried changing the patient’s height, age, race and gender to see if it would make a difference and although this made small changes in the percent predicted when I did this the predicteds were still zero.

Or were they? They actually couldn’t have been zero, regardless of what was showing up on the report, since the observed test values are divided by the predicted values and if the predicted were really zero, then we’d have gotten a “divide by zero” error, and that wasn’t happening. Instead the predicted values had to be very close to zero, but not actually zero, and the software was rounding the value down to zero for the report. Simple math showed me the predicted value for FVC was (very) approximately 0.0103 liters, but why was this happening?

Continue reading

LLN versus 80%

Recently a rather eminent reader commented on an older blog entry. He finished his comment with a paragraph on another topic, however. Specifically:

By the way, it is also high time that we scuttle the habit of expressing a measurement as percent of predicted. As Sobol wrote [5]: “It implies that all functions in pulmonary physiology have a variance around the predicted, which is a fixed per cent of predicted. Nowhere else in medicine is such a naive view taken of the limit of normal.”

I understand the point and have been thinking about this off and on since the comment was posted but I keep coming back to the same response, and that is “yes, but…”.

First the “yes” part.

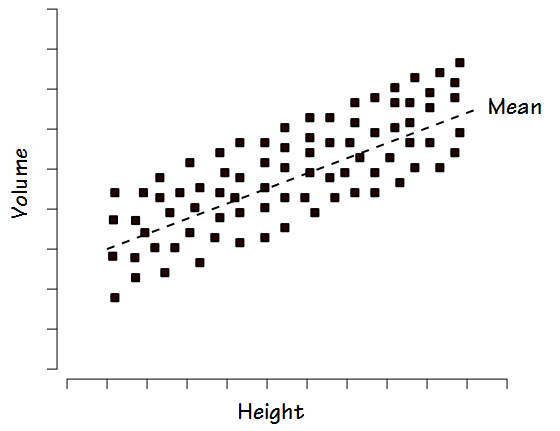
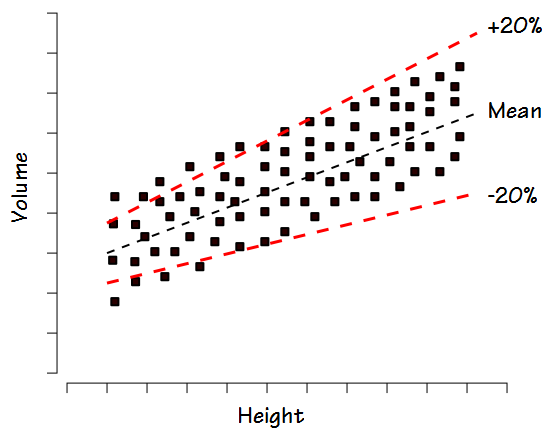
Other than the fact that any percent of predicted cutoff is an arbitrary line in the sand (80% of predicted is most commonly used as the cutoff for normalacy but why not 75%? why not 85%?) the biggest argument against the use of percent predicted is the way in which normal values tend to be distributed. When FVC or TLC is studied within a reasonably large group of “normal” individuals the results are usually distributed fairly evenly above and below the mean. This is referred to as a homoscedastic distribution.

Homoscedastic_Distribution

For this reason when, for example, +/- 20% is used as the normal range this tends to exclude some normal individuals with lower volumes and heights and includes some individuals with larger volumes and heights that are probably not normal.

Homoscedastic_versus_20pct

Continue reading

An FVC is not an SVC

I’ve discussed the issue of inserting a predicted FVC into the predicted lung volumes several times now. At the risk of beating this issue to death I’d like to put to rest the notion that an FVC and an SVC are the same thing.

A Forced Vital Capacity (FVC) maneuver is designed to measure the maximum expiratory flow rates, in particular the expired volume in 1 second (FEV1). It has long been recognized that the effort involved in the FVC maneuver can cause early airway closure, even in individuals with normal lungs, and that for this reason the vital capacity can be underestimated due to gas trapping. This effect is usually magnified with increasing age and in individuals with obstructive lung disease.

A Slow Vital Capacity (SVC) maneuver is designed to measure the lung volume subdivisions Inspiratory Capacity (IC) and Expiratory Reserve Volume (ERV), and to maximize the measured volume of the vital capacity. Due to the more relaxed nature of the SVC maneuver there is significantly less airway closure and for this reason the SVC volume is usually larger than the FVC, again even in individuals with normal lungs.

Comparing individual reference equations can be difficult but in general the reference equations for SVC and FVC agree with this. Taking the available SVC and FVC reference equations (unfortunately limited to Caucasian because there are almost no SVC equations for other ethnicities) it is apparent that the average predicted SVC is larger than the average predicted FVC, and that the magnitude of this difference increases with age:

SVC_vs_FVC_Male

Continue reading

The ratio-nal approach to predicted TLC

I’ve been reading Miller et al’s Laboratory evaluation of Pulmonary Function which was published in 1987. That was an interesting time since PFT equipment manufacturers had mostly transitioned to computerized systems but there were still a lot of manual systems in the field. For this reason the book’s instructions are still oriented mostly around manual pulmonary function testing and there are numerous warnings about double-checking the results from automated systems.

The book includes extensive discussion on the calculations and formulas used for testing which makes it useful as a teaching resource. The authors were also very concerned about the correct way to run a PFT lab so there is a fair amount of discussion about staff requirements for education and training (including the medical director) and staff behavior and conduct. To this end each chapter includes extensive instructions on the proper way to perform tests and treat patients. Although the tone of this is somewhat dated and I’d like to say these kind of reminders shouldn’t be necessary, it doesn’t hurt to set a standard on the level of professionalism we should aspire to.

What caught my eye though, was a section in the chapter on Normal Values titled Interdependence of Normal Values which discussed of the value of deriving predicted TLC from predicted FVC. The authors were concerned that reference equations for different tests (and not just lung volumes) were being selected without concern for how well they fit together. I’ve previously written about the problems that results when inserting the reference equation for FVC into the reference equations for lung volumes. In one instance, the TLC was adjusted so that the final predicted TLC was equal to RV + VC, but this meant that TLC (and IC) were changed from the original reference equations. In another, the FVC was just substituted for SVC without adjustment which meant that RV + VC was not equal to TLC and IC + ERV was not equal to VC and this makes interpreting results problematic. What this means however, is that almost 30 years after this was published, this problem is still around.

As a solution, the authors point out that ratios, such as the FEV1/FVC ratio and the RV/TLC ratio tend to be relatively independent of height.

Since:

TLC = FVC + RV

This can be mathematically re-written as:

Which means that TLC can be derived from predicted FVC if the RV/TLC ratio is known.

Continue reading