N2 washout is affected by N2 excretion and other factors

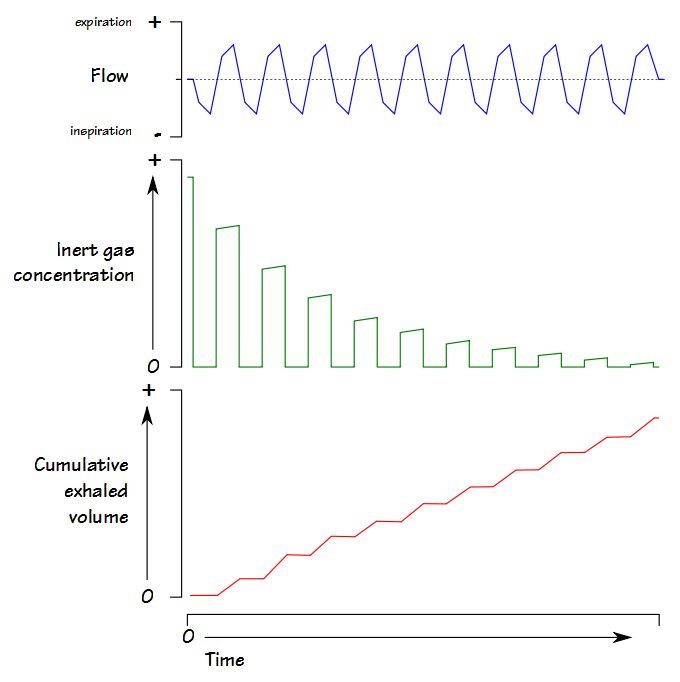
The Lung Clearance Index (LCI) was first described in 1952 by Margaret Becklake, and is defined as the number of lung volume turnovers required to reduce the concentration of a tracer gas by a factor of 40. LCI is calculated as the cumulative exhaled volume (CEV) during the washout divided by the functional residual capacity (FRC).

Clinically LCI has been used most often in individuals with cystic fibrosis and this is because the LCI has been repeatably shown to be sensitive to changes in airway status that are not reflected in the FEV1. LCI has shown similar results in patients with primary ciliary dyskinesia. As expected LCI has also been tested on patients with COPD, bronchiectasis and asthma although these patients tend to show a better correlation between FEV1 and LCI.

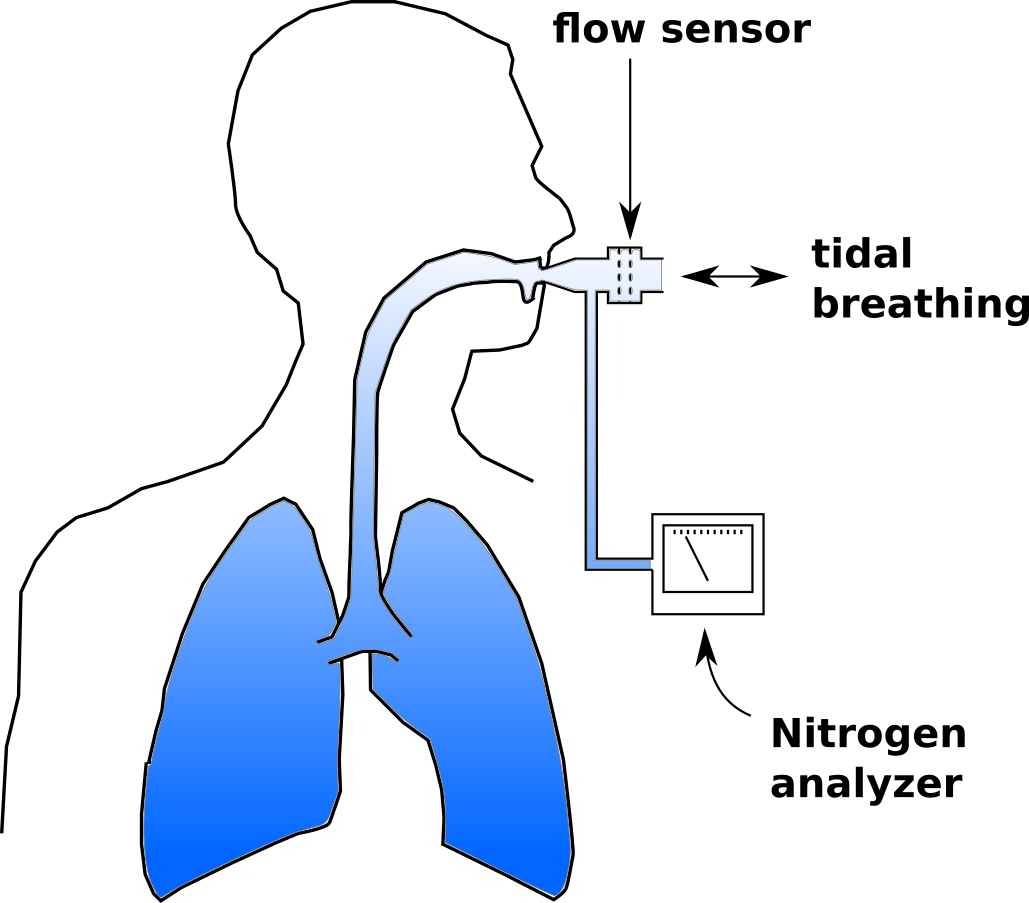
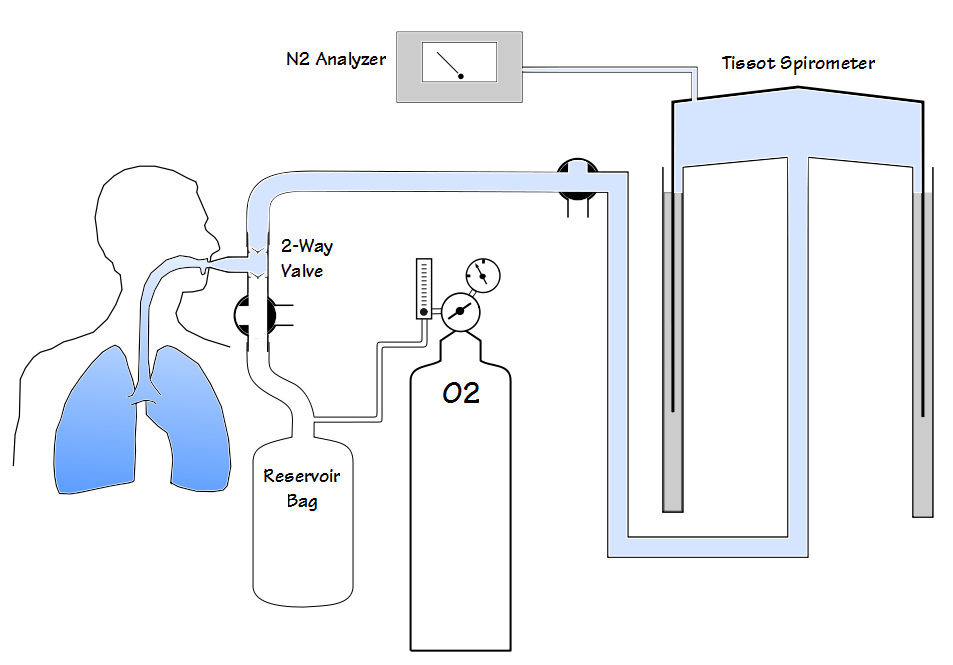
LCI has been performed using a wide variety of tracer gases including helium, methane, argon, nitrogen and sulfur hexaflouride (SF6). The commercial systems that are currently available use either N2 or SF6. N2 washout LCI has recently received a great deal of criticism and some of these criticisms seem to apply to N2 washout lung volumes as well.

Most specifically, a number of studies have noted that the N2 washout FRC is routinely higher than the SF6 FRC and plethysmographic FRC. In addition, the N2 washout LCI tends to be significantly higher than the SF6 LCI and this difference increases as LCI increases.

As examples in a study of patients with COPD the N2 washout FRC averaged 14% higher than the plethysmographic FRC. In other studies of normal subjects the N2 washout FRC was on average 0.20 to 0.21 L higher than plethysmographic FRC. Finally, a study that performed N2 and SF6 washouts simultaneously on CF patients and healthy controls showed the N2 washout LCI to be on average 7.93% higher than SF6 in the healthy controls and 29.13% higher than SF6 in the CF patients. In the same study N2 washout FRC was 12.66% higher than SF6 FRC in the healthy controls and 30.09% higher than SF6 FRC in CF patients.

So why is there such a discrepancy?

Continue reading

Getting more out of the LCI with Scond and Sacin

The Lung Clearance Index (LCI) is a relatively simple test that provides a measure of ventilation inhomogeneity within the lung. This can be clinically useful information since several studies have shown that increases in LCI often precede decreases in FEV1 in cystic fibrosis and post-lung transplant. LCI results are only a general index into ventilation inhomegeneity however, and other than showing its presence, does not give any further information about its cause or location.

There is additional information that can be derived from an LCI test that can indicate the general anatomic location where ventilation inhomegeneity (or alternatively, ventilation heterogeneity) is occurring; specifically the conducting or acinar airways. This can be done because changes in the slope of the tidal N2 washout waveform during an LCI test are sensitive to the conduction-diffusion wavefront in the terminal bronchioles. Careful analysis of these slopes permits the derivation of two indexes; Scond, an index of the ventilation heterogeneity in the conducting airways; and Sacin, an index of ventilation heterogeneity the acinar airways.

To review, an LCI test is a multi-breath nitrogen washout test. An individual is switched into a breathing circuit with 100% O2.

Once this happens tidal volume is measured continuously and used to determine the cumulative exhaled volume. Exhaled nitrogen is also measured continuously and is used to determine the cumulative exhaled nitrogen volume. The LCI test continues until the end-tidal N2 concentration is 1/40th of what is was initially (nominally 2%). At that point FRC is calculated using the cumulative exhaled nitrogen volume:

FRC (L) = Exhaled N2 Volume / (Initial N2 Concentration – Final N2 concentration)

LCI is calculated by:

LCI = Cumulative Exhaled Volume (L) / FRC (L)

and is essentially a measure of how much ventilation is required to clear the FRC. When an individual tidal breath from the LCI test is graphed, it looks similar to a standard single-breath N2 washout:

and can be similarly subdivided into phase I (dead space washout), phase II (transition) and phase III (alveolar gas).

Continue reading

N2 washout troubleshooting

I was recently contacted by the manager of a lab that was having problems with their N2 washout lung volumes. Specifically, their N2 washout lung volumes (FRC in particular) were coming out low and everyone being tested on the system looked like they had restriction. The system has been checked by the manufacturer’s service techs several times and they’d replaced the tubing, the O2 tank and a number of parts. Service first asked them to wait between tests and then not to bother. Most lately they’ve been asked to calibrate the system before each test. Despite all this, their system continues to under-estimate lung volumes.

We’ve all had seemingly intractable problems with our test systems at one time or another. Sometimes they’re problems that can only be fixed by replacing major components, such as a gas analyzer or a motherboard. Sometimes they turn out to be something simple that nobody noticed despite looking straight at it numerous times. Experience and good technical support helps, but for every test system there has to be at least a couple of problems that are either uncommon, difficult to diagnose or are happening for the first time. When this happens it’s best to go back to basics and try to see what it is that’s most likely to explain the symptoms.

N2 washout lung volume measurements measure the amount of nitrogen residing in the lung and use this to estimate the volume of the entire lung. Closed circuit lung volume measurements using nitrogen were first attempted in 1932 by Christie. Christie’s approach used a known volume of oxygen to dilute the nitrogen in the lung but accuracy was limited at least in part because the amount of oxygen in the closed circuit was constantly changing due to the subject’s oxygen uptake. In 1940 Darling et al demonstrated an open circuit technique that is the basis for current N2 washout tests. In this approach the nitrogen in a subject’s lung was washed out with 100% O2 and their exhaled air was collected in a Tissot spirometer. After a certain amount of time (nominally 7 minutes) the exhaled volume and the N2 concentration in the Tissot spirometer was measured. The amount of nitrogen that had been exhaled is then calculated using simple math and the subject’s FRC is estimated from that.

Continue reading

What’s abnormal about FRC?

I’ve had a number of reports across my desk in the last couple of weeks with both elevated and reduced FRC’s that were associated with a more-or-less normal TLC. I reviewed the raw data from all of these tests (I review the raw data from all lung volume tests) and in only a few instances did I make any corrections to the report. This made me think however, about what, if anything, is an abnormal FRC trying to tell us?

The answers to that question range from “a whole bunch” to “not much” to “darned if I know”. When you measure lung volumes TLC is really the only clinically important result. RV can be useful at times but although the other lung volume subdivisions may play a role in the measurement process they have only a limited diagnostic value. All lung volume measurements start with FRC, however, and if you don’t know you have an accurate FRC how do you know that TLC is accurate?

FRC is a balance point of opposing forces in the lung and thorax. Lung tissue wants to collapse, the rib cage wants to spring open and the diaphragm wants to do whatever muscle tone, gravity and the abdomen allows it to do. All of these forces are to one extent or another dynamic and can change over time. These changes can occur both slowly and rapidly, and are the primary reason why isolated changes in FRC don’t tend to have a lot of clinical significance. For all lung volume measurements however, one primary assumption is that FRC does not change during the test and this isn’t necessarily true.

Continue reading

The ERV Effect

I used to think that spirometry and diffusion capacity tests were hard and that lung volumes were easy. That may have been true in terms of getting patients to do the tests but I’ve long since come to the conclusion that it is easier to assess the quality of spirometry and diffusing capacity tests and know whether you have reasonably accurate results than it is to do this for lung volumes regardless of which lung volume measurement technique you use.

I was reviewing a set of plethysmographic lung volume tests when I noticed something very odd about the reported results. I usually look at just the VTG loops and the volume-time graphs in order to assess test quality. The testing software automatically selects and averages all VTG efforts and when I reviewed them there were a couple loops that were poor quality and I manually de-selected them. I was reviewing this report because the reported lung volume results didn’t quite match what the spirometry results were saying so this time I also took a close look at the numbers after I removed the low-quality loops. That’s when I realized that the reported TLC was larger than the two tests it was averaged from.

Pleth Math

Continue reading

N2 washout drift throws another curve.

Just when we thought it was safe to go back in the water, we’ve run into another N2 washout-related problem. Although it probably affects the TLC and RV calculations in a minor way, it was actually noticed in relation to spirometry.

When spirometry is reviewed in my lab the FVC is compared to the SVC, if one has been performed. If the SVC is greater than FVC, then the FEV1/VC ratio is recalculated using the SVC. This is in line with the ATS recommendations on interpreting spirometry and does occasionally throw up a patient with airway obstruction that otherwise would not have been detected.

I have been reviewing the raw data from all of the lung volume tests lately. My lab has a mix of equipment and performs lung volumes with helium dilution, nitrogen washout and by plethysmograph. I’ve mentioned previously that we went through a major upgrade in equipment and software over the summer and this extra scrutiny on lung volumes is in part because of the problems we’ve had with the nitrogen washout test.

Continue reading

Busted for speeding during an N2 washout

Nitrogen washout lung volumes are still relatively new to my PFT Lab. The number of problems we’ve encountered has decreased substantially but we are still learning some of the idiosyncrasies of the system. Recently while trying to understand a test with odd results we were reminded by the manufacturer that during the washout period a patient’s inspiratory and expiratory flow rates should not exceed 1.5 liters/second. The reason this “speed limit” is necessary highlights some of the limitations of modern open-circuit lung volume measurements.

The basic concept behind nitrogen washout is relatively simple. The air we breathe contains 78% nitrogen which is a relatively inert, insoluble gas. If you have a patient breathe 100% oxygen and then collect their exhaled air you can calculate the volume of exhaled nitrogen by multiplying the concentration in the exhaled air by the total volume of air that was collected. Once you know the volume of nitrogen you can then calculate the lung volume.

Initially this was a laborious and cumbersome process. The patient’s exhaled breathing circuit and a Tissot Gasometer (a very large spirometer with a volume between 125 and 300 liters) are first flushed with oxygen several times to remove any nitrogen. Next, while breathing room air the patient exhales to RV and an end-expiratory gas sample is taken and used to estimate the patient’s alveolar nitrogen concentration. The patient is then switched to 100% oxygen and breathes for seven minutes. At the end of the washout period the nitrogen concentration of the exhaled gas in the gasometer is analyzed and the volume recorded.

 N2_Washout_System_JCI_v19_n4_p609_1940

Continue reading

N2 washout switch-in error

I have been taking a close look at the raw data from all lung volume tests lately in large part because N2 washouts are still relatively new to my PFT Lab and we’re continuing to learn from our mistakes. When I saw this N2 washout test I knew that there was something wrong with it. The patient had performed three N2 washout tests and the TLC, FRC and RV for this one test were significantly larger than for the other tests. The most common problem we’ve been having with N2 washouts has been with patient leaks during the washout period which almost always show up as an upwards drift in the tidal baseline. This test did not show any drift however, and it took me a little while before I could see what was wrong with it.

The N2 washout maneuver has the patient start by breathing tidally for a short period of time in order to determine where end-exhalation (FRC) is located. The patient then performs a slow vital capacity maneuver by steadily inhaling maximally to TLC and then exhaling maximally to RV. The technician then switches the patient into the washout breathing circuit at maximal exhalation and the patient resumes breathing tidally for the remainder of the test.

Continue reading

Lung volume measurements and software smarts.

Many years ago I used to think that lung volume measurements were the easy part of PFTs. As time has gone on I’ve seen that getting accurate lung volume measurements is actually more difficult than getting accurate spirometry and DLCO results mostly because the errors tend to be subtle.

The errors that occur in lung volume measurements tend to cause an overestimation of lung volumes. This often means that restrictive diseases can be unrecognized or that hyperinflation and gas trapping can be diagnosed where it does not exist.

I see questionable lung volume test results more often than I’d like even from experienced technicians. When I find what went wrong I try to use these as “teachable moments” for all the the lab staff. Despite this the number of questionable test results never seems to drop below a certain level. I’d much prefer the error level was zero but since this is a situation that involves humans making measurements on humans I am likely being overly optimistic. A more realistic goal is to ask that the testing systems be smarter.

Continue reading