Making Assumptions about TGV and FRC

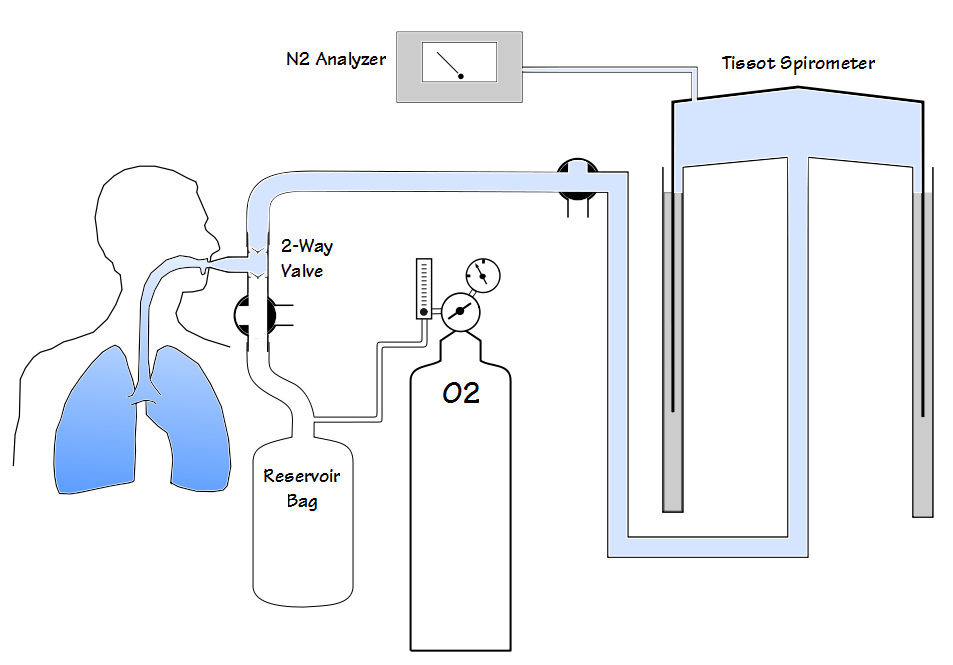
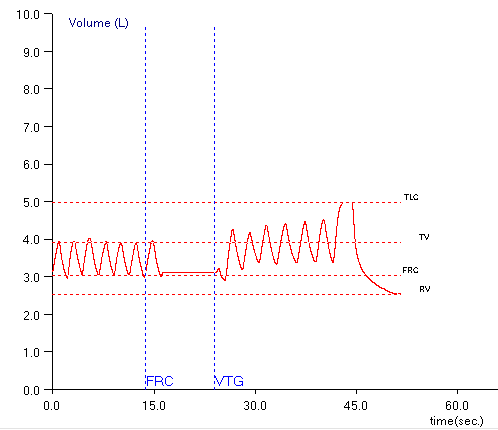
When lung volumes are measured in a plethysmograph the actual measurement is called the Thoracic Gas Volume (TGV). This is the volume of air in the lung at the time the shutter closes and the subject performs a panting maneuver. Ideally, the TGV measurement should be made at end-exhalation and should be approximately equal to the Functional Residual Capacity (FRC). For any number of reasons in both manual and automated systems this doesn’t happen and the point at which the TGV is measured is either above or below the FRC.

Testing software usually corrects for the difference in TGV and FRC by determining the end-exhalation baseline that is present during the tidal breathing at the beginning of the test. Using this value the software can determine where the TGV was measured relative to the tidal breathing FRC and then either subtracts or adds a correction factor to derive the actual FRC volume.

One problem with this is that leaks in either the subject or the mouthpiece and valve manifold can occur during the panting maneuver and the end-exhalation baseline can shift and this will affect the calculation of RV and TLC. I’ve discussed this previously and as a reminder, RV is calculated from:

RV = [average FRC] – [average ERV]

where the FRC is determined from the corrected TGV and ERV is determined from SVC maneuvers. TLC is then calculated from:

TLC = RV + [largest SVC]

When the post-shutter FRC baseline shifts upwards (higher lung volumes relative to the pre-shutter FRC):

ERV is underestimated, which in turn causes both RV and TLC to be overestimated. When the post-shutter FRC baseline shifts downwards (lower lung volumes relative to the pre-shutter FRC):

ERV is overestimated, which in turn causes both RV and TLC to be underestimated.

I’ve been aware of this problem for quite a while and use this as a guideline when selecting the FRCs and SVCs from specific plethysmograph tests. All of these assumptions are based on the fact that FRC is derived from the pre-shutter end-exhalation tidal breathing. Well, you know what they say about assuming…

Continue reading

Contraindications

A couple weeks ago I was asked whether it was safe for a patient with an abdominal aortic aneurysm (AAA) to have pulmonary function testing. My first thought was that it was probably unsafe but after a moment or two of thought I realized that I hadn’t reviewed the subject for a long time. When I checked the 2005 ATS/ERS general testing guidelines (there are no contraindications in the 2005 spirometry guidelines) I found that AAA wasn’t mentioned at all. In fact, the only absolute contraindication mentioned was that patients with a recent myocardial infarction (<1 month) should not be tested. Some relative contraindications were mentioned:

  • chest or abdominal pain
  • oral or facial pain
  • stress incontinence
  • dementia or confusional state

and activities that should be avoided prior to testing include:

  • smoking within 1 hour of testing
  • consuming alcohol within 4 hours of testing
  • performing vigorous exercise within 30 minutes of testing
  • wearing clothing that restricts the chest or abdomen
  • eating a large meal with 2 hours of testing

but these were factors where test results were likely to be suboptimal and not actually contraindications.

This got me curious since I thought that pulmonary function testing was contraindicated for more conditions than just an MI. I reviewed the 1994 and and then the 1987 ATS statements on spirometry but again found no mention of contraindications. Ditto on the 1993 ERS statement on spirometry and lung volumes. Finally, in the 1996 AARC clinical guidelines for spirometry I found a much longer list of contraindications:

  • hemoptysis of unknown origin
  • pneumothorax
  • recent mycardial infarction
  • recent pulmonary embolus
  • thoracic, abdominal or cerebral aneuysms
  • recent eye surgery
  • presence of an acute disease process that might interfere with test performance (e.g. nausea, vomiting)
  • recent surgery of thorax or abdomen

So where did the AARC’s list of contraindications come from? And why is there such a discrepancy between the ATS/ERS and the AARC guidelines?

Continue reading

An unusual error in helium dilution lung volumes

Recently I was reviewing a report that included helium dilution lung volumes. What caught my eye was that the TLC and the FRC didn’t particularly fit in with the results from the other tests the patient had performed.

Test: Observed: %Predicted:
FVC: 2.83 114%
     
TLC: 3.03 71%
FRC: 0.88 39%
RV: 0.09 5%
SVC: 2.93 118%
     
VA: 3.64 88%

When compared to the FVC and the VA (from the DLCO test) the lung volumes are significantly lower. In particular the FRC and RV are markedly reduced. This is somewhat unusual for helium dilution lung volume since most errors usually cause FRC, RV and TLC to be over-estimated instead of being under-estimated. When I checked the other reports for the day I found that two other patients that had had their lung volumes measured on the same test system also had a TLC, FRC and RV that were noticeably reduced. Obviously we had some kind of equipment problem with that test system but it took a bit of sleuthing before I found out what had happened.

Like all lung volume tests, the helium dilution technique produces a lot of numbers, most of which are not included on the report. One of the first things I did was to call up the within-test data (our test systems store data every 15 seconds during the test and re-calculate FRC each time).

Time: FRC, Liters He conc. (%) Ve (L./min.) Vt, Liters
0:15 -1.00 9.71 6.16 0.21
0:30 0.06 8.87 10.1 0.59
0:45 0.43 8.61 11.76 0.78
1:00 0.69 8.44 9.05 0.72
1:15 0.76 8.39 8.18 0.74
1:30 0.79 8.37 8.32 0.59
1:45 0.82 8.36 8.15 0.62
2:00 0.83 8.35 7.79 0.65
2:15 0.86 8.33 5.51 0.62
2:30 0.87 8.32 5.34 0.63
2:45 0.88 8.32 0 0

When looking at this it was immediately evident there was a problem because the initial FRC was negative and this shouldn’t be possible. About the only way that helium dilution lung volumes can normally be underestimated is if the test is terminated way too early and the negative FRC ruled this out. It also narrows down the possible problems, but I had to think for a while and in doing so had to go back to the basics of the helium dilution test.

Helium dilution used to be the most common method for measuring lung volumes, but it requires a closed-circuit test system with a volume displacement spirometer. Most current test systems are open-circuit flow sensor-based systems and lung volumes are usually measured by nitrogen washout (or by plethysmography). Nevertheless, there are a couple of closed-circuit systems still being manufactured and there are a fair number of these systems still in service.

Continue reading

What’s the frequency, plethysmograph?

Once again we’ve had some staff turnover. Rightly or wrongly, the pattern we follow in staffing the lab is to hire people with a science degree and then train them ourselves. Our hires are usually interested in a career in medicine but often haven’t decided what specifically interests them. We look for individuals with people skills on top of their education and ask for a minimum of a year’s commitment with the requirement that they get their CPFT certification by the end of the year. Sometimes our staff only stays a year, sometimes a couple years, and most of the time when they leave they go back to college for a more advanced degree and become nurses or physician assistants and occasionally even physicians (a couple of our pulmonary fellows were former PFT lab alumni).

We do this mostly because it’s very hard to find anybody with prior experience in pulmonary function testing. I’d like to say this is a recent occurrence but realistically it’s been this way for decades. One of the reasons for this is that there are no college level courses on pulmonary function testing. Although the training programs for respiratory therapists often include some course work on PFTs this is almost always a one semester lecture course with no hands-on training (when it is included at all).

Another reason is that trained individuals often do not stay in this field. This is partly because there isn’t much of a career path since the most you can usually aspire to is being a lab manager but even then I know of many small PFT labs where the manager is somebody outside the field such as a nurse or administrator with no experience in pulmonary function testing so often that isn’t even an option. Another reason though, is that the PFT Lab pay scale, although adequate, is often noticeably less than other allied health professions such as radiology techs, ultrasound techs and sleep lab techs.

Anyway, the downside of this hiring pattern is that it seems like we’re always hiring and training new staff (however untrue that may actually be). We do have a fairly good training program however, so new staff usually come up to speed and become reasonably productive in a short period of time. Even so, it takes at least a year before a new technician is reasonably proficient not just in performing the tests, but in understanding the common testing problems and errors. This is at least one reason why I spend much of my time reviewing raw test data and sending annoying emails to the lab staff.

It also means that we frequently revisit basic testing issues.

Recently, a report with a full panel of tests (spirometry, lung volumes, DLCO) came across my desk. The patient had had a full panel a half a year ago and when I compared the results between the two sets of tests there had been no significant change in FVC, FEV1 and DLCO but the TLC was over a liter higher than it had been last time.

Jan, 2017 June, 2016
Observed: %Predicted: Observed: %Predicted:
FVC: 2.04 85% 2.38 97%
FEV1: 0.58 32% 0.62 34%
FEV1/FVC: 28 38% 26 36%
TLC: 7.27 152% 6.10 126%
FRC: 6.16 222% 4.83 174%
DLCO: 8.12 51% 8.91 55%

Continue reading

N2 washout troubleshooting

I was recently contacted by the manager of a lab that was having problems with their N2 washout lung volumes. Specifically, their N2 washout lung volumes (FRC in particular) were coming out low and everyone being tested on the system looked like they had restriction. The system has been checked by the manufacturer’s service techs several times and they’d replaced the tubing, the O2 tank and a number of parts. Service first asked them to wait between tests and then not to bother. Most lately they’ve been asked to calibrate the system before each test. Despite all this, their system continues to under-estimate lung volumes.

We’ve all had seemingly intractable problems with our test systems at one time or another. Sometimes they’re problems that can only be fixed by replacing major components, such as a gas analyzer or a motherboard. Sometimes they turn out to be something simple that nobody noticed despite looking straight at it numerous times. Experience and good technical support helps, but for every test system there has to be at least a couple of problems that are either uncommon, difficult to diagnose or are happening for the first time. When this happens it’s best to go back to basics and try to see what it is that’s most likely to explain the symptoms.

N2 washout lung volume measurements measure the amount of nitrogen residing in the lung and use this to estimate the volume of the entire lung. Closed circuit lung volume measurements using nitrogen were first attempted in 1932 by Christie. Christie’s approach used a known volume of oxygen to dilute the nitrogen in the lung but accuracy was limited at least in part because the amount of oxygen in the closed circuit was constantly changing due to the subject’s oxygen uptake. In 1940 Darling et al demonstrated an open circuit technique that is the basis for current N2 washout tests. In this approach the nitrogen in a subject’s lung was washed out with 100% O2 and their exhaled air was collected in a Tissot spirometer. After a certain amount of time (nominally 7 minutes) the exhaled volume and the N2 concentration in the Tissot spirometer was measured. The amount of nitrogen that had been exhaled is then calculated using simple math and the subject’s FRC is estimated from that.

Continue reading

IC, ERV and the FVC

While reviewing reports today I ran across a couple of lung volume tests from different patients where the SVC was over a liter less than the FVC. Suboptimal SVC measurement can affect both the TLC and the RV and in one case the TLC was slightly below normal (78% of predicted) and in the other the TLC was within normal limits but the RV was over 150% of predicted. Both patients had had lung volume measurements previously and the current TLC was significantly different than it had been before.

I seem to run across this problem at least once a week so I am reasonably used to making manual corrections. I’ve discussed this previously but basically I use the position of the tidal loop within the maximal flow-volume loop obtained during spirometry to determine IC and ERV and then re-calculate TLC and RV accordingly.

fvl_tvl_4

Anyway, for this reason I had tidal loops, and IC and ERV on my mind while I was reviewing other reports. Shortly after this I came across a report that had “fair FVC test quality and reproducibility” in the tech notes so I pulled up the raw spirometry test data and took a closer look.

What I found was that the patient had performed five spirometry efforts and that the FVC and FEV1 was different on each test. All five spirometry efforts met the ATS/ERS criteria for back-extrapolation, expiratory time and end-of-test flow rates. I clicked back and forth between the different spirometry efforts to make sure the right FVC and FEV1 had been selected and when I did I noticed that the position of the tidal loop was shifting left and right and that the closer it was to TLC, the lower the FVC and FEV1 were and vice versa.

fvl_tvl_1

Continue reading

Asleep at the wheel

During this last week I was contacted by two different individuals who were asking for help in understanding their PFT results. In both cases they had a markedly elevated TLC and the interpretation included the notation that they had gas trapping and hyperinflation. Even though the amount of information they provided was minimal I am extremely skeptical that the TLC measurements were correct.

Gas trapping usually only occurs with severe airway obstruction. Hyperinflation, which at minimum consists of a chronically elevated FRC and RV, usually only occurs after prolonged gas trapping. An elevated TLC usually occurs only with prolonged hyperinflation and given the improvements in the care and treatment of COPD I’ve seen over the last several decades, has become relatively uncommon.

But one individual had perfectly normal spirometry:

%Pred:
FVC: 107%
FEV1: 112%
FEV1/FVC: 105%
TLC: 143%

Continue reading

A change that probably isn’t a change

Recently a report came across my desk from a patient being seen in the Tracheomalacia Clinic. The clinic is jointly operated by Cardio-Thoracic Surgery and Interventional Pulmonology and among other things they stent airways. The patient had been stented several months ago and this was a follow-up visit. Given this I expected to see an improvement in spirometry, which had happened (not a given, BTW, some people’s airways do not tolerate stenting), but what I didn’t expect to see was a significant improvement in lung volumes and DLCO.

When I took a close look at the results however, it wasn’t clear to me that there really had been a change. Here’s the results from several months ago:

Observed: %Predicted: Predicted:
FVC: 1.19 50% 2.38
FEV1: 0.64 35% 1.79
FEV1/FVC: 53 71% 76
TLC: 3.21 76% 4.22
FRC: 2.34 96% 2.43
RV: 2.11 113% 1.85
RV/TLC: 66 150% 44
SVC: 1.15 48% 2.37
IC: 0.87 48% 1.80
ERV: 0.25 41% 0.58
DLCO: 6.59 38% 16.18
VA: 1.78 43% 4.12
IVC: 1.04

Change_that_isnt_change_2015_FVL_redacted_2

[more] Continue reading

An FVC is not an SVC

I’ve discussed the issue of inserting a predicted FVC into the predicted lung volumes several times now. At the risk of beating this issue to death I’d like to put to rest the notion that an FVC and an SVC are the same thing.

A Forced Vital Capacity (FVC) maneuver is designed to measure the maximum expiratory flow rates, in particular the expired volume in 1 second (FEV1). It has long been recognized that the effort involved in the FVC maneuver can cause early airway closure, even in individuals with normal lungs, and that for this reason the vital capacity can be underestimated due to gas trapping. This effect is usually magnified with increasing age and in individuals with obstructive lung disease.

A Slow Vital Capacity (SVC) maneuver is designed to measure the lung volume subdivisions Inspiratory Capacity (IC) and Expiratory Reserve Volume (ERV), and to maximize the measured volume of the vital capacity. Due to the more relaxed nature of the SVC maneuver there is significantly less airway closure and for this reason the SVC volume is usually larger than the FVC, again even in individuals with normal lungs.

Comparing individual reference equations can be difficult but in general the reference equations for SVC and FVC agree with this. Taking the available SVC and FVC reference equations (unfortunately limited to Caucasian because there are almost no SVC equations for other ethnicities) it is apparent that the average predicted SVC is larger than the average predicted FVC, and that the magnitude of this difference increases with age:

SVC_vs_FVC_Male

Continue reading

The ratio-nal approach to predicted TLC

I’ve been reading Miller et al’s Laboratory evaluation of Pulmonary Function which was published in 1987. That was an interesting time since PFT equipment manufacturers had mostly transitioned to computerized systems but there were still a lot of manual systems in the field. For this reason the book’s instructions are still oriented mostly around manual pulmonary function testing and there are numerous warnings about double-checking the results from automated systems.

The book includes extensive discussion on the calculations and formulas used for testing which makes it useful as a teaching resource. The authors were also very concerned about the correct way to run a PFT lab so there is a fair amount of discussion about staff requirements for education and training (including the medical director) and staff behavior and conduct. To this end each chapter includes extensive instructions on the proper way to perform tests and treat patients. Although the tone of this is somewhat dated and I’d like to say these kind of reminders shouldn’t be necessary, it doesn’t hurt to set a standard on the level of professionalism we should aspire to.

What caught my eye though, was a section in the chapter on Normal Values titled Interdependence of Normal Values which discussed of the value of deriving predicted TLC from predicted FVC. The authors were concerned that reference equations for different tests (and not just lung volumes) were being selected without concern for how well they fit together. I’ve previously written about the problems that results when inserting the reference equation for FVC into the reference equations for lung volumes. In one instance, the TLC was adjusted so that the final predicted TLC was equal to RV + VC, but this meant that TLC (and IC) were changed from the original reference equations. In another, the FVC was just substituted for SVC without adjustment which meant that RV + VC was not equal to TLC and IC + ERV was not equal to VC and this makes interpreting results problematic. What this means however, is that almost 30 years after this was published, this problem is still around.

As a solution, the authors point out that ratios, such as the FEV1/FVC ratio and the RV/TLC ratio tend to be relatively independent of height.

Since:

TLC = FVC + RV

This can be mathematically re-written as:

Which means that TLC can be derived from predicted FVC if the RV/TLC ratio is known.

Continue reading