CPET Test Interpretation, Part 4: Interpretation and Summary

After having gone through the descriptive checklists for ventilatory, gas exchange and circulatory limitations the reason(s) for a patient’s exercise limitation, if any, should be reasonably clear. However, one of the first questions that should be asked when reading an exercise test is what was the purpose of the test?

  • Maximum safe exercise capacity for Pulmonary Rehab?
  • Rule in/rule out exercise-induced bronchospasm?
  • Pre-operative assessment?
  • Dyspnea of uncertain etiology?
  • What is the primary limitation to exercise (pulmonary or cardiac)?
  • Is deconditioning suspected?

The interpretation and summary should address these concerns.

The descriptions checklist is the main groundwork for the actual interpretation and any abnormal findings there may signal the need for specific comments. The interpretation should start by indicating whether or not the patient’s exercise capacity was normal and then should indicate the presence or absence of any limitations.

What was the patient’s maximum exercise capacity (maximum VO2)?

  • >120% = Elevated
  • 80% to 120% = Normal
  • 60% to 79% = Mildly reduced
  • 40% to 59% = Moderately reduced
  • <40% = Severely reduced

Example: There was a {elevated | normal | mildly reduced | moderately reduced | severely reduced} exercise capacity as indicated by the maximum oxygen consumption of XX%.

Continue reading

CPET Test Interpretation, Part 3: Circulation

I would like to re-emphasize the importance of the descriptive part of CPET interpretation. At the very least consider it to be a checklist that should always be reviewed even when you think you know what the final interpretation is going to be.

After gas exchange, the next step in the flow of gases is circulation. The descriptive elements for assessing circulation are:

What was the maximum heart rate?

The maximum predicted heart rate is calculated from 220 – age.

A maximum heart rate above 85% of predicted indicates that there has been an adequate exercise test effort.

Example: The maximum heart rate was XX% of predicted {which indicates an adequate test effort}.

What was the heart rate reserve?

The heart rate reserve is (predicted heart rate – maximum heart rate). A heart rate reserve that is greater than 20% of the (predicted heart rate – resting heart rate) is elevated and may be an indication of either chronotropic incompetence or an inadequate test effort.

Note: A negative heart rate reserve will occur whenever a patient exceeds their predicted heart rate.

Example: The heart rate reserve is XX BPM which is {within normal limits | elevated}.

Continue reading

CPET Test Interpretation, Part 2: Gas Exchange

I would like to re-iterate the importance of the descriptive part of CPET interpretation. At the very least consider it to be a checklist that should always be reviewed even when you think you know what the final interpretation is going to be.

After ventilation, the next step in the flow of gases is gas exchange. The descriptive elements for assessing gas exchange are:

What was the maximum oxygen consumption (VO2)?

The maximum oxygen consumption is the prime indicator of exercise capacity. Predicted values should be based on patient height, age, weight and gender.

Note: There is actually a surprising limited number of reference equations for maximum VO2. The only one I’ve found that takes weight into consideration in a realistic manner is Wasserman’s algorithm. Some test systems do not offer this reference equation but I feel it is worthwhile for it to be calculated and used regardless. See appendix for the algorithm.

Note: The maximum VO2 does not necessarily occur at peak exercise (i.e. test termination). This can happen in various types of cardiac and vascular diseases but also because the patient may decrease the level of their exercise before the test is terminated.

  • Maximum VO2 > 120% of predicted = Elevated
  • Maximum VO2 = 80% to 119% of predicted = Normal
  • Maximum VO2 = 60% to 79% of predicted = Mild impairment
  • Maximum VO2 = 40% to 59% of predicted = Moderate impairment
  • Maximum VO2 < 40% of predicted = Severe impairment

Example: The maximum VO2 was X.XX LPM { which is {mildly | moderately | severely } decreased | within normal limits | elevated}.

Continue reading

CPET Test Interpretation, Part 1: Ventilatory response

I’ve always found interpreting CPET tests to be one of the more interesting (and enjoyable) things I’ve done. Interpreting a CPET test is both more difficult and easier than interpreting regular PFTs. More difficult because there are a lot more parameters involved and easier because determining test adequacy and the primary cause(s) of an exercise limitation tends to be clearer.

I’ve found that you have to go back to basic physiology whenever you interpret CPETs and that always boils down to the flow of oxygen and carbon dioxide.

Abnormalities in gas flow that occurs at any of these steps will leave a distinctive pattern in the test results. I’ve developed a structured approach to interpreting CPET results that includes a descriptive part as well as the interpretation and summary. The descriptive part may appear to be tedious but I’ve always found it to be absolutely critical to the actual interpretation.

The descriptive elements for assessing the ventilatory response to exercise are:

What was the baseline spirometry?

Note: Spirometry pre- and post-exercise should always be performed as part of a CPET, even when exercise-induced bronchoconstriction is not suspected. This is so that normal values for the ventilatory response to exercise can be determined.

Example: The FVC was {normal | mildly reduced | moderately reduced | moderately severely reduced | very severely reduced}. The FEV1 was {normal | mildly reduced | moderately reduced | moderately severely reduced | very severely reduced}. The FEV1/FVC ratio was was {normal | mildly reduced | moderately reduced | severely reduced}.

What was the post-exercise change in FEV1?

A decrease in FEV1 ≧ 15% following exercise is abnormal and suggests exercise-induced bronchoconstriction.

Note: FEV1 can increase post-exercise and an increase up to 5% is normal. Some patients with reactive airway disease bronchodilate with exercise and can an increase ≧ 15% from baseline, particularly if they were obstructed to begin with. Although strictly speaking this is not abnormal, it does suggest the presence of labile airways.

Example: There was {a significant decrease / no significant change / a significant increase} in FEV1 following exercise.

Continue reading

A modest proposal for a clinical spirometry grading system

A while back I reviewed the spirometry grading system that was included in the 2017 ATS reporting standards. My feeling was, and continues to be, that its usefulness is very limited because it’s mostly a reproducibility grading system that relies on a few easy-to-measure parameters. This doesn’t mean that a grading system can’t be helpful, just that it needs to be focused differently.

In a clinical PFT lab many patients have difficulty performing adequate and reproducible spirometry, but that doesn’t mean the results aren’t clinically useful. Moreover, suboptimal quality results may be the very best the patient is ever able to produce. So what’s more important in a grading system than reproducibility is the ability to assess the clinical utility of a reported spirometry effort.

The two most important results that come from spirometry are the FEV1 and the FVC, and I strongly believe that they need to be assessed separately. For each of these values there are two aspects that need to be determined. First, is there a reliable probability that the reported value is correct? Second, are any errors causing the reported value to be underestimated or overestimated? The two are inter-related since a value with excellent reliability is not going to have any significant errors, but if there are errors then a reviewer needs to know which direction the result is being biased.

The current ATS/ERS standards contain specific thresholds for certain spirometry values such as expiratory time and back-extrapolation. Although these are certainly indications of test quality they are almost always used in a binary [pass | fail] manner. In order to assess clinical usefulness however, you instead need to grade these on a scale. For example an expiratory time of 5.9 seconds for spirometry from a 60 year-old individual would mean that there is a small probability that the FVC is underestimated, but with an expiratory time of 1.9 seconds the FVC would have a very high probability of being underestimated and this needs to be recognized in order to assess clinical utility.

Note: Although the A-B-C-D-F grading system is rather prosaic it is still universally understandable, so I will use it for grading reliability. An A grade or an F grade are probably easy to assign but differentiating between B-C-D may be more subjective, particularly since reliability depends on multiple parameters and judging their relative contribution is always going to be subjective at some point. For bias, I will be using directional characters (↑↓) to show the direction of the bias (i.e. positive or negative), so ↑ will indicate probable overestimation, ↓ will indicate probable underestimation, and ~ indicates a neutral bias.

FEV1 / Back extrapolation:

Back-extrapolation is a way to assess the quality of the start of a spirometry effort and the accuracy of the timing of the FEV1. The ATS/ERS statement says that the back-extrapolated volume must be less that 5% of the FVC or less than 0.150 L, whichever is greater.
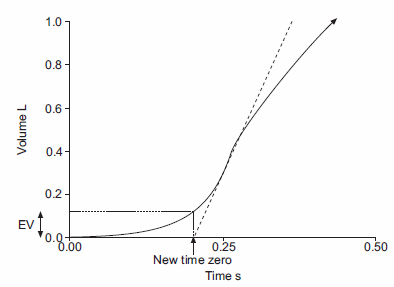
My experience is that an elevated back-extrapolation tends to cause FEV1 to be overestimated far more often than underestimated. So a suggested grading system for back-extrapolation would be (and I’ll be the first to admit these are off the top of my head and open for discussion):

FEV1:    
Back-Extrapolation: Reliability: Bias:
Within standards: A ~
> 1 x standard, < 1.5 x standard: B
> 1.5 x standard, < 2 x standard C ↑↑
> 2 x standard, < 2.5 x standard: D ↑↑↑
> 2.5 x standard F ↑↑↑↑

Continue reading

Is gas trapping more common than we think it is?

Over the last couple of years I’ve run across a number of test systems that do not include tidal loops along with the maximal flow-volume loop. I’ve wondered why this was done and because of this I’ve thought a lot about tidal flow-volume loops and what additional information, if any, they add to spirometry interpretation.

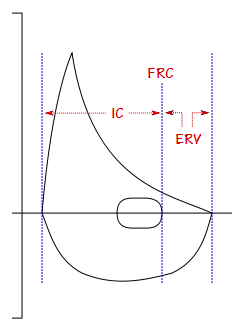
One of my thoughts has been about the relationship between obesity and the IC and ERV. FVC and TLC are often reasonably preserved even with relatively severe obesity. FRC, on the other hand, is often noticeably affected with even minor changes in BMI (and interestingly this applies to reduced as well as elevated BMI’s). When FRC decreases because of obesity the IC usually increases and the ERV decreases and for this reason the IC/ERV ratio has been suggested as a way to monitor changes in FRC without having to actually measure lung volumes.

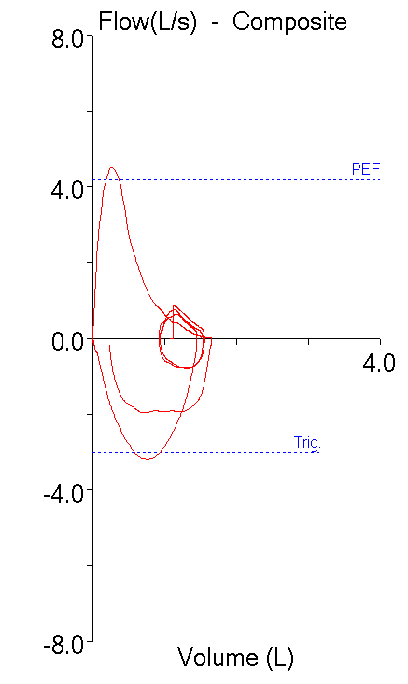
IC and ERV are not measured as part of spirometry but the position of the tidal loops gives at least a general indication of their magnitude and I’ve noticed that there’s a moderately good correlation between BMI and the position of the tidal loop.

With this in mind, I see up to a dozen reports a week with restrictive-looking spirometry (i.e. symmetrically reduced FVC and FEV1 with a normal FEV1/FVC ratio) on patients with a diagnosis of asthma. This is nothing new and there have probably been at least 10 articles in the last decade about the Restrictive Spirometry Pattern (RSP). Interpreting these kinds of spirometry results is always problematic, particularly when there are no prior lung volume measurements to rule-in or rule-out restriction. I’ve noticed however, that patients with a restrictive spirometry pattern almost always have the tidal loop on the far right-hand side of the flow-volume loop (zero or near zero ERV). For example:

Observed: %Predicted:
FVC: 1.65 74
FEV1: 1.21 73
FEV1/FVC: 73 100

But there doesn’t seem to be any relationship between this observation and the patient’s BMI and in fact, this is seen even when BMI is normal or somewhat reduced. Continue reading

DLCO, de-constructed

My wife watches the Food Network a lot and I occasionally watch it with her but I can only take so much of it before I go off and read or work on one of my projects. I’ve noticed however in the various cooking contests that sometimes a chef will deconstruct a familiar recipe. This more or less means they break the recipe down into its components and present them as separate pieces or perhaps by putting what goes inside on the outside instead.

I’ve discussed the DLCO test with numerous people and have found that many know and understand (or at least remember) the ATS/ERS criteria for test quality. At the same time however, there seems to be very few people that understand the formula used to calculate the single-breath DLCO and I suspect this is probably because most of us didn’t like the mathematics classes we had to attend in high school or college (and tried to forget what we learned as quickly as we could afterwards).

The DLCO formula isn’t that complicated however, and more importantly all the components of the DLCO test and the reasons for the ATS/ERS quality criteria are embedded within it. All this seems to be a good reason to de-construct the DLCO “recipe” and try to explain it’s various pieces.

As a reminder the single-breath DLCO formula is:

Where:

VA = alveolar volume in ml

BHT = breath holding time in seconds

Pb = barometric pressure

PH2O = partial pressure of water vapor in the lung

FITrace = fractional concentration of tracer gas in the inspired DLCO mixture

FATrace = fractional concentration of tracer gas in the alveolar sample

FICO = fractional concentration of CO in the inspired DLCO mixture

FACO = fractional concentration of CO in the alveolar sample

I think the part that bothers everybody the most is:

and that’s because there’s two different things going on here. First, the part within the brackets:

is intended to correct the initial CO concentration for the dilution that occurs when the DLCO test gas mixture is inhaled and mixes with the gas that was within the lung at the start of the inhalation. The whole point of the DLCO test is to measure CO uptake but the initial concentration for this measurement is not what’s in the tank, it’s what’s in the lungs after it has been diluted by the lung’s residual volume and deadspace gas.
Continue reading

Why the FEV1/FVC ratio LLN as a percent of the predicted FEV1/FVC ratio is important

My medical director and I had a discussion today about where the cutoff for a normal FEV1/FVC ratio would be for a 93 year old patient of his. Part of the problem is that there are almost no reference equations for patients this age and the best you can usually do is to extrapolate. Another part is that anybody in their 90’s is a survivor and must have had good lung function throughout their life to reach that age, which means that they aren’t average so it’s not clear how well extrapolation actually works in this population. The final part is that the guidelines for PFT interpretation that are used by my lab were put into place about 40 years ago and reflect the thoughts at that time. I updated part of the guidelines with the 2005 ATS/ERS interpretation algorithm about 10 years ago, but the thresholds for normalcy (as well as the reference equations we use) still haven’t changed all that much. I’ve brought this issue up a number of times over the years (usually every time I get a new medical director) but haven’t gotten a consensus from the pulmonary physicians on either the need for change or for what threshold values should be used.

Anyway, both my medical director and I felt felt that the LLN for the FEV1/FVC ratio (when viewed as a percent of the predicted FEV1/FVC ratio) is probably lower for a 75 year old (and certainly for a 93 year old) than it is for a 25 year old, and that the current lab guidelines for interpretation were probably diagnosing airway obstruction in the elderly more often than they should. My lab currently uses the NHANESIII reference equations for spirometry however, and I wasn’t sure they showed this particularly well since the equations for the FEV1/FVC ratio and its LLN are quite simplistic compared to those for FVC and FEV1.

The NHANESIII reference equations were published in 1999 and at that time they were derived from the largest population that had ever been studied (7428 subjects, 40.9% male, 59.1% female) and with the most sophisticated statistical analysis that had been used up until that time. In 2012 however, the Global Lung Function Initiative (GLI) released a set of reference equations using data obtained from 73 centers world-wide on 97,759 subjects (44.7% male, 55.3% female). Statistical analysis of the GLI data was performed using the Lambda, Mu, Sigma (LMS) approach and a set of equations were derived that covered ages 3 to 95.

I have some reservations about how well the GLI equations match the population served by my lab but it’s a moot point whether I like them or not since even now, 5 years after the GLI equations were published, my lab’s software has not been updated to include them. The reason for this is that the GLI spirometry equations use what are called “splines” to generate the spirometry reference values and these are taken from a look-up table. My lab’s software does have an equation editor but it will not accommodate lookup tables so the GLI equations can’t be added. I’m sure our equipment manufacturer could get around this if they really wanted to, but so far it hasn’t happened.

I do have a lot of respect for the GLI equations however, and think that the overall view they give of the normal distribution of FVC, FEV1 and the FEV1/FVC ratio is far more correct than those of any prior studies. Using a spreadsheet tool downloaded from the GLI that lets me generate the GLI spirometry predicted values and the NHANESIII reference equations I decided to take a closer look at their predicted FEV1/FVC ratios and their LLNs.

Continue reading

What’s wrong with an elevated DLCO?

Well, not necessarily anything, although as usual that depends on the circumstances. Recently I was contacted by an individual who was concerned that their DLCO had decreased from 120% of predicted to 99% of predicted. They also mentioned that their DLCO results have normally ranged from 117% to 140% of predicted over the last 9 months.

More interestingly however, they said that

“the technician told me before I even took the test that anything over 100% for DLCO is essentially a testing error.”

Wow. That statement is wrong on so many levels it’s hard to know where to start but I’ll give it a shot anyway.

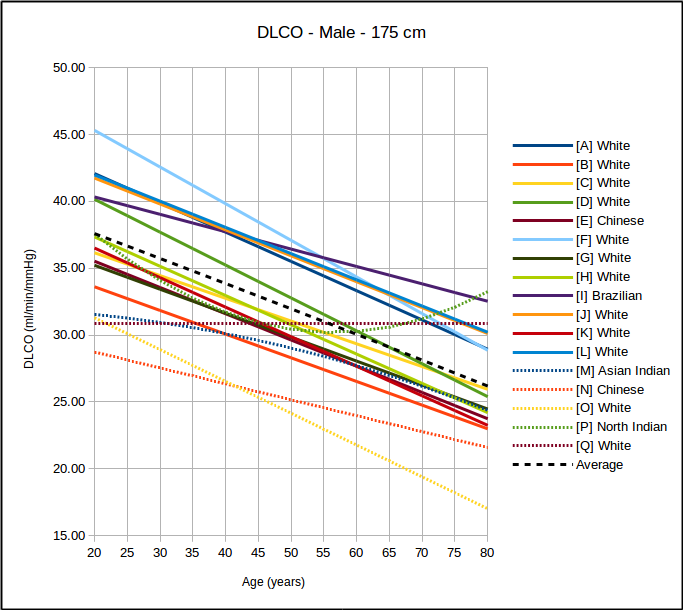
First, there are a variety of DLCO reference equations. The ATS/ERS guidelines recommends that PFT Labs pick the reference values that most closely matches their patient population but how this is done is left to individual labs. There are at least a couple dozen DLCO reference equations to choose from and probably about a half dozen of these are in common use in PFT labs around the world.

Because no patient population is ever going to precisely match those of a study this means that DLCO results are going to tend to be above or below 100% of predicted depending on which reference equation the lab is actually using. This also means that if results from otherwise normal subjects are mostly above or mostly below 100% of predicted then the wrong reference equations are being used.

Continue reading

Z Score to remember is -1.645

The use of Z scores to report PFT results, both clinically and for research is occurring more and more frequently. Both the Z score and the Lower Limit of Normal (LLN) come from the same roots and in that sense can be said to be saying much the same thing. The difference between the two however, is in the emphasis each places on how results are analyzed. The LLN primarily emphasizes only whether a result is normal or abnormal. The Z score is instead a description of how far a result is from the mean value and therefore emphasizes the probability that a result is normal or abnormal.

Reference equations are developed from population studies and the measurements that come from these studies almost always fall into what’s called a normal distribution (also known as a bell-shaped curve).

A normal distribution has two important properties: the mean value and the standard deviation. The mean value is essentially the average of the results while the standard deviation describes whether the distribution of results around the mean is narrow or broad.

The simple definition of the Z score for a particular result is that it is the number of standard deviations that a result is away from the mean. It is calculated as:

Continue reading