2019 ATS/ERS Spirometry Standards

The 2019 ATS/ERS Spirometry Standards were recently released. The standards are open-access and can be downloaded without charge from the October 15th issue of the American Journal of Respiratory and Critical Care Medicine. Supplements are available from the same web page.

The 2019 Spirometry Standards have been extensively re-organized with numerous updates. Notably, a number of sections that were previously discussed in the 2005 General Considerations for Lung Function Testing have been updated and included in the 2019 Spirometry Standards. Also notably, a number of stand-alone spirometry tests, including the Flow-Volume Loop, PEF and MVV are not included in the 2019 Standards.

An overview of changes and updates from the 2005 Spirometry Standards are detailed within the 2019 Spirometry Standards (page e71, column 1, paragraph 2) and in the Data Supplement (pages E2-E3). In more detail these include:

◆ The list of indications for spirometry (page e73, table 1) was updated primarily with changes in language.

  • “To measure the effect of disease on pulmonary function” was updated to “To measure the physiological effect of disease or disorder”
  • “To describe the course of diseases that affect lung function” was updated to “To monitor disease progression”
  • “To monitor people exposed to injurious agents” was updated to “To monitor people for adverse effects of exposure to injurious agents”

◆ Items added to indications:

  • “Research and clinical trials”
  • “Preemployment and lung health monitoring for at-risk occupations”

◆ Contraindications were previously mentioned in the 2005 General Considerations rather than the 2005 Spirometry Standards and these have been extensively updated and expanded. Although the list of contraindications (page e74, table 2) is fairly inclusive (and should be reviewed by all concerned) there were items mentioned in the body of text that were not in the table:

  • “Spirometry should be discontinued if the patient experiences pain during the maneuver.”
  • “…because spirometry requires the active participation of the patient, inability to understand directions or unwillingness to follow the directions of the operator will usually lead to submaximal test results.”

◆ Notably, abdominal aortic aneurysm (AAA) was not included as a contraindication in the 2019 standards. (page e72, column 3, paragraph 1)

Continue reading
FEV1 and VC should be measured separately

The FEV1 and VC both provide quite different information about a patient’s lungs. Unfortunately, spirometry as it is currently practiced is optimized towards generating an accurate FEV1 more than an accurate VC. This is partly due to limitations in the maneuver itself and partly due to the lack of accurate end-of-test criteria for an adequate VC. In one sense this is okay since more than one person that I’ve known and respected has said that “it’s all about the FEV1”.

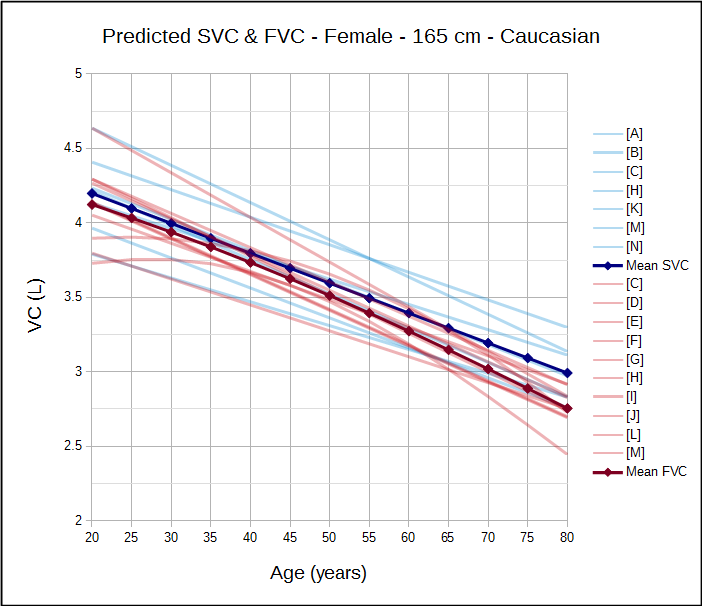
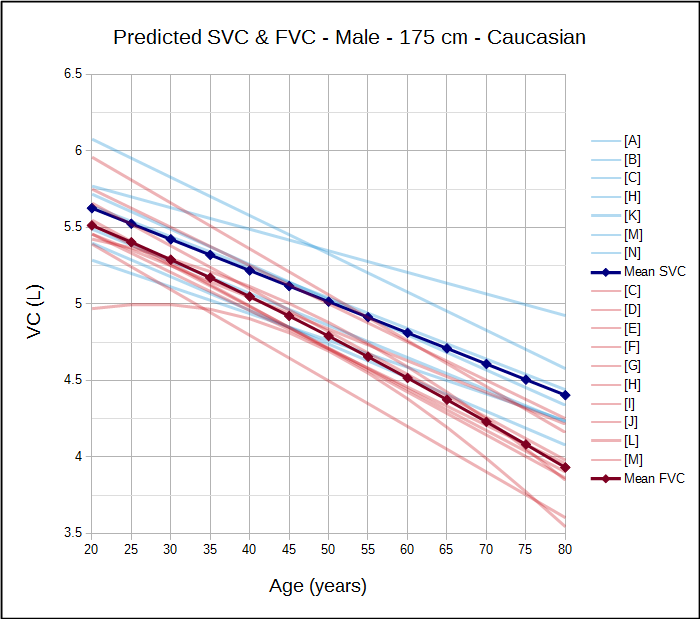
Having said that, an accurate FEV1/VC ratio is essential for detecting and quantifying airway obstruction and an SVC maneuver is more likely to obtain a more accurate VC. This matters because the current ATS/ERS spirometry guidelines recommend that the FEV1/VC be reported, where the VC is the largest value obtained from any test and reference equations indicate that the SVC is routinely larger than the FVC:

So, shouldn’t we be routinely performing both FVC and SVC maneuvers when we do spirometry on our patients? And why aren’t we?

Continue reading

A modest proposal for a clinical spirometry grading system

A while back I reviewed the spirometry grading system that was included in the 2017 ATS reporting standards. My feeling was, and continues to be, that its usefulness is very limited because it’s mostly a reproducibility grading system that relies on a few easy-to-measure parameters. This doesn’t mean that a grading system can’t be helpful, just that it needs to be focused differently.

In a clinical PFT lab many patients have difficulty performing adequate and reproducible spirometry, but that doesn’t mean the results aren’t clinically useful. Moreover, suboptimal quality results may be the very best the patient is ever able to produce. So what’s more important in a grading system than reproducibility is the ability to assess the clinical utility of a reported spirometry effort.

The two most important results that come from spirometry are the FEV1 and the FVC, and I strongly believe that they need to be assessed separately. For each of these values there are two aspects that need to be determined. First, is there a reliable probability that the reported value is correct? Second, are any errors causing the reported value to be underestimated or overestimated? The two are inter-related since a value with excellent reliability is not going to have any significant errors, but if there are errors then a reviewer needs to know which direction the result is being biased.

The current ATS/ERS standards contain specific thresholds for certain spirometry values such as expiratory time and back-extrapolation. Although these are certainly indications of test quality they are almost always used in a binary [pass | fail] manner. In order to assess clinical usefulness however, you instead need to grade these on a scale. For example an expiratory time of 5.9 seconds for spirometry from a 60 year-old individual would mean that there is a small probability that the FVC is underestimated, but with an expiratory time of 1.9 seconds the FVC would have a very high probability of being underestimated and this needs to be recognized in order to assess clinical utility.

Note: Although the A-B-C-D-F grading system is rather prosaic it is still universally understandable, so I will use it for grading reliability. An A grade or an F grade are probably easy to assign but differentiating between B-C-D may be more subjective, particularly since reliability depends on multiple parameters and judging their relative contribution is always going to be subjective at some point. For bias, I will be using directional characters (↑↓) to show the direction of the bias (i.e. positive or negative), so ↑ will indicate probable overestimation, ↓ will indicate probable underestimation, and ~ indicates a neutral bias.

FEV1 / Back extrapolation:

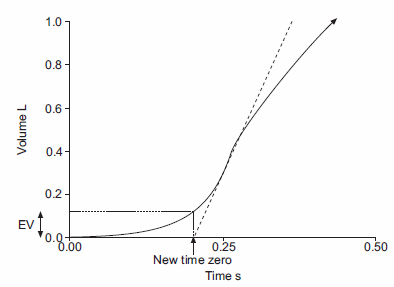
Back-extrapolation is a way to assess the quality of the start of a spirometry effort and the accuracy of the timing of the FEV1. The ATS/ERS statement says that the back-extrapolated volume must be less that 5% of the FVC or less than 0.150 L, whichever is greater.

My experience is that an elevated back-extrapolation tends to cause FEV1 to be overestimated far more often than underestimated. So a suggested grading system for back-extrapolation would be (and I’ll be the first to admit these are off the top of my head and open for discussion):

FEV1:    
Back-Extrapolation: Reliability: Bias:
Within standards: A ~
> 1 x standard, < 1.5 x standard: B
> 1.5 x standard, < 2 x standard C ↑↑
> 2 x standard, < 2.5 x standard: D ↑↑↑
> 2.5 x standard F ↑↑↑↑

Continue reading

Is gas trapping more common than we think it is?

Over the last couple of years I’ve run across a number of test systems that do not include tidal loops along with the maximal flow-volume loop. I’ve wondered why this was done and because of this I’ve thought a lot about tidal flow-volume loops and what additional information, if any, they add to spirometry interpretation.

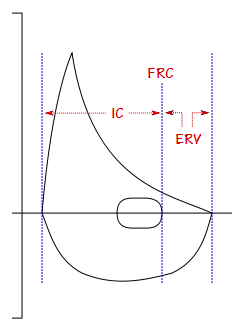
One of my thoughts has been about the relationship between obesity and the IC and ERV. FVC and TLC are often reasonably preserved even with relatively severe obesity. FRC, on the other hand, is often noticeably affected with even minor changes in BMI (and interestingly this applies to reduced as well as elevated BMI’s). When FRC decreases because of obesity the IC usually increases and the ERV decreases and for this reason the IC/ERV ratio has been suggested as a way to monitor changes in FRC without having to actually measure lung volumes.

IC and ERV are not measured as part of spirometry but the position of the tidal loops gives at least a general indication of their magnitude and I’ve noticed that there’s a moderately good correlation between BMI and the position of the tidal loop.

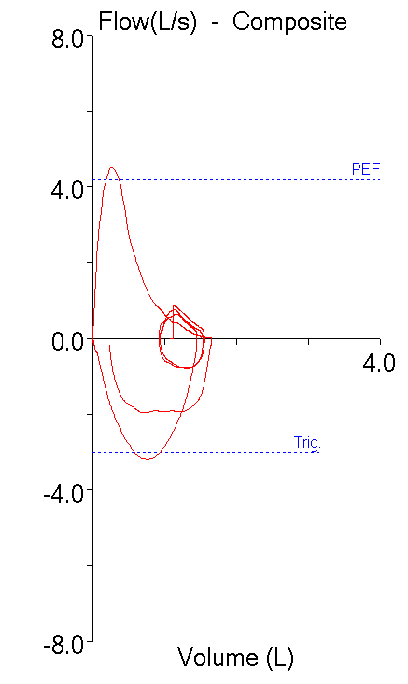
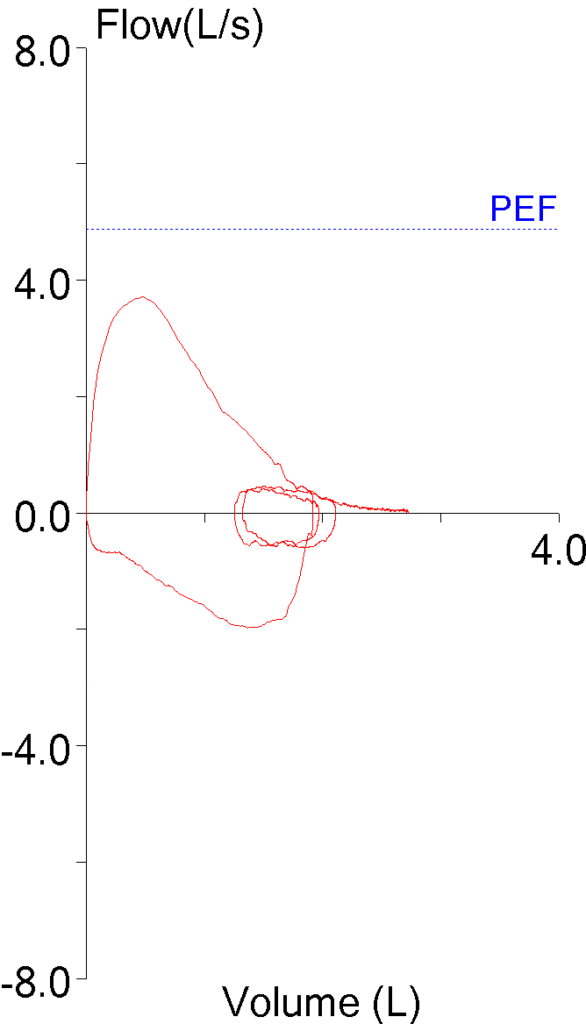
With this in mind, I see up to a dozen reports a week with restrictive-looking spirometry (i.e. symmetrically reduced FVC and FEV1 with a normal FEV1/FVC ratio) on patients with a diagnosis of asthma. This is nothing new and there have probably been at least 10 articles in the last decade about the Restrictive Spirometry Pattern (RSP). Interpreting these kinds of spirometry results is always problematic, particularly when there are no prior lung volume measurements to rule-in or rule-out restriction. I’ve noticed however, that patients with a restrictive spirometry pattern almost always have the tidal loop on the far right-hand side of the flow-volume loop (zero or near zero ERV). For example:

Observed: %Predicted:
FVC: 1.65 74
FEV1: 1.21 73
FEV1/FVC: 73 100

But there doesn’t seem to be any relationship between this observation and the patient’s BMI and in fact, this is seen even when BMI is normal or somewhat reduced. Continue reading

Assessing post-BD improvement in FEV1 and FVC as a percent of the predicted

The 2005 ATS/ERS standards for assessing post-bronchodilator changes in FVC and FEV1 have been criticized numerous times. A recent article in the May issue of Chest (Quanjer et al) has taken it to task on two specific points:

  • the change in FVC and FEV1 has to be at least 200 ml
  • the change is assessed based on the percent change (≥12%) from the baseline value

The article points out that the 200 ml minimum change requires a proportionally larger change for a positive bronchodilator response in the short and the elderly. Additionally, by basing the post-BD change on the baseline value it lowers the threshold (in terms of an absolute change) for a positive bronchodilator response as airway obstruction become more severe. As a way of mitigating these problems the article recommends looking at the post-bronchodilator change as a percent of predicted rather than as a percent of baseline.

The article is notable (and its authors are to be commended) because it studied 31,528 pre- and post-spirometry records from both clinical and epidemiological sources from around the world. For the post-bronchodilator FEV1 and FVC:

  • the actual change in L
  • the percent change from baseline
  • the change in percentage of predicted
  • the Z-score

were determined.

Continue reading

Normal or obstruction?

I had finished reviewing a pre- and post-BD spirometry report yesterday and was about to toss it on my out pile when I noticed something a bit odd about the post-BD results. I pulled it back and spent some time trying to decide if the interpretation needed to be changed but after a lot of internal debate I finally let it go as it was. I’ve continued to think about it however, and although I’m not sure that was the right decision I still haven’t come up with a clear answer.

Here’s what I saw:

Observed: %Predicted: Post-BD: %Predicted: %Change:
FVC: 3.70 97% 3.91 103% +6%
FEV1: 2.82 94% 2.79 93% -1%
FEV1/FVC: 76 95% 71 89% -6%
PEF: 6.62 94% 7.19 102% +9%
Exp. Time: 10.92 11.15

The reported pre-BD and post-BD results were from good quality tests and met the criteria for repeatability. My problem is that the baseline results were normal but if I had seen the post-BD results by themselves I would have considered them to show mild airway obstruction.

Continue reading

Which time is it?

The ATS/ERS standard for spirometry recommends reporting the highest FEV1 and the highest FVC even when they come from different tests. Our lab software allows us to do this, but only with some annoying limitations. One of the bigger limitations has to do with how expiratory time is reported. In particular, expiratory time is lumped in with a number of other values like Peak Flow (PEF) and FEF25-75. As importantly, the flow-volume loop and volume-time curve can only come from a single effort.

Our lab software defaults to choosing a single effort with the highest combined FVC+FEV1. The technician performing the tests will override this when other spirometry efforts have a larger FVC or a better FEV1 (which is chosen not just if it is higher but also on the basis of peak flow, back-extrapolation and other quality indicators). The usual order for this is to first choose a spirometry effort with the “best” FEV1, then if there is a different effort with a larger FVC that FVC is selected for reporting. When things are done this way what happens is that the expiratory time, flow-volume loop and volume-time curve that come from the effort selected for its FEV1 are reported. This means is that the expiratory time and volume-time curve often don’t match the reported FVC.

I always take a look at the raw test data whenever a spirometry report comes across my desk with an expiratory time less than 6 seconds or the technician noted that the spirometry effort is a composite. What I often find is that even though the reported expiratory time may be low, the FVC actually comes from an effort with an adequate expiratory time. Although I can select the right expiratory time the problem is that doing so also selects the PEF and the PEF from the effort with the highest FVC is often significantly less than the effort from the best FEV1. The same problem applies to selecting the volume-time curve since the associated flow-volume loop often doesn’t match the effort with the best FEV1 and best PEF. For these reasons I only select the correct expiratory time and volume-time curve when it doesn’t really affect the flow-volume loop and PEF.

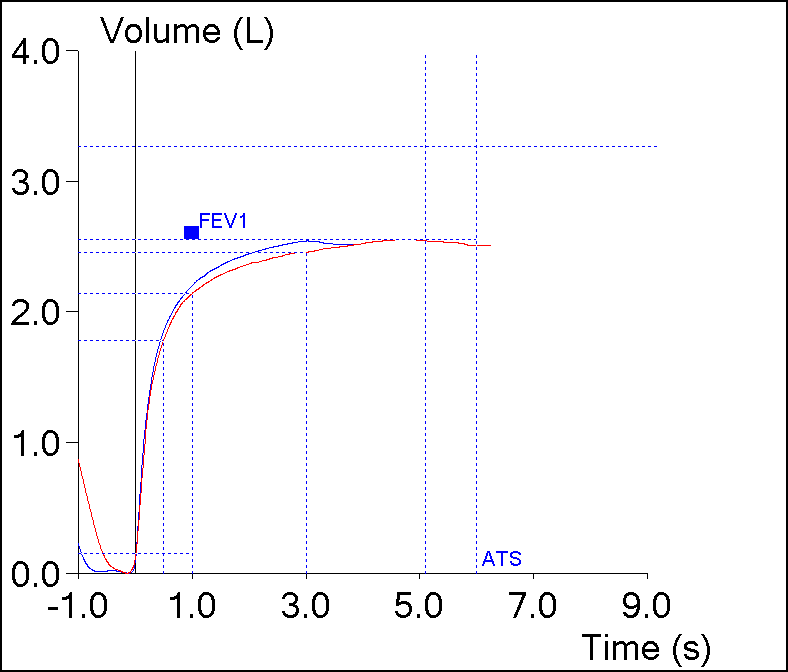
However, I’ve always assumed that the expiratory time from the effort with the highest FVC was probably the most correct expiratory time. Yesterday however, this spirometry effort came across my desk:

Blue Red
FVC: 2.53 2.54
FEV1: 2.19 2.13
FEV1/FVC: 86 84
PEF: 6.94 5.07
Exp. Time: 3.05 5.09

Continue reading

Is there airway obstruction when the FEV1 is normal?

I’ve been reviewing the literature on PFT interpretation lately and in doing so I ran across one of the issues that’s bothered me for a while. Specifically, my lab has been tasked with following the 2005 ATS/ERS guidelines for interpretation and using this algorithm these results:

Observed: %Predicted: LLN: Predicted:
FVC: 2.83 120% 1.76 2.36
FEV1: 1.77 100% 1.26 1.76
FEV1/FVC: 63 84% 65 75

would be read as mild airway obstruction.

Although it’s seems odd to have to call a normal FEV1 as obstruction I’ve been mostly okay with this since my lab has a number of patients with asthma whose best FVC and FEV1 obtained at some point in the past were 120% of predicted or greater but whose FEV1 frequently declines to 90% or 100% of predicted. In these cases since prior studies showed a normal FEV1/FVC ratio then an interpretation of a mild OVD is probably correct even though the FEV1 itself is well above the LLN, and this is actually the situation for this example.
Continue reading

The FVC/DLCO ratio. Will the real percent predicted please stand up?

Recently a reader asked me a question about the FVC/DLCO ratio. To be honest I’d never heard of this ratio before which got me intrigued so I spent some time researching it. What I found leaves me concerned that a lack of understanding about reference equations may invalidate several dozen interrelated studies published over the last two decades.

Strictly speaking the FVC/DLCO ratio is the %predicted FVC/%predicted DLCO ratio (which is usually abbreviated FVC%/DLCO%) and it appears to be used exclusively by specialists involved in the treatment of systemic sclerosis and related disorders. Specifically, the ratio is used to determine whether or not a patient has pulmonary hypertension. The basic idea is that (quoting from a letter to the editor):

“As we know, in ILD both FVC and DLCO fall and their fall is proportionate, whereas in pulmonary arterial hypertension DLCO falls significantly and disproportionately to FVC.”

A variety of algorithms using the FVC%/DLCO% have been devised. Inclusion factors are usually an FVC < 70% of predicted and a DLCO (corrected for hemoglobin) < 60% of predicted. A number of different threshold values for FVC%/DLCO% have been published ranging from 1.4 to 2.2 with the differences appearing to be dependent on study population characteristics and the type of statistical analysis performed. It is thought that individuals meeting the inclusion factors with an FVC%/DLCO% ratio above the threshold most probably have pulmonary hypertension.

Continue reading

COPD and the FEV1/FVC ratio. GOLD or LLN?

Everyone uses the FEV1/FVC ratio as the primary factor in determining the presence or absence of airway obstruction but there are differences of opinion about what value of FEV1/FVC should be used for this purpose. Currently there are two main schools of thought; those that advocate the use the GOLD fixed 70% ratio and those that instead advocate the use the lower limit of normal (LLN) for the FEV1/FVC ratio.

The Global Initiative for Chronic Obstructive Lung Disease (GOLD) has stated that a post-bronchodilator FEV1/FVC ratio less than 70% should be used to indicate the presence of airway obstruction and this is applied to individuals of all ages, genders, heights and ethnicities. The official GOLD protocol was first released in the early 2000’s and was initially (although not currently) seconded by both the ATS and ERS. The choice of 70% is partly happenstance since it was one of two fixed FEV1/FVC ratio thresholds in common use at the time (the other was 75%) and partly arbitrary (after all why not 69% or 71% or ??).

The limitations of using a fixed 70% ratio were recognized relatively early. In particular it has long been noted that the FEV1/FVC ratio declines normally with increasing age and is also inversely proportional to height. For these reasons the 70% threshold tends to over-diagnose COPD in the tall and elderly and under-diagnose airway obstruction in the short and young. Opponents of the GOLD protocol say that the age-adjusted (and sometimes height-adjusted) LLN for the FEV1/FVC ratio overcomes these obstacles.

Proponents of the GOLD protocol acknowledge the limitation of the 70% ratio when it is applied to individuals of different ages but state that the use of a simple ratio that is easy to remember means that more individuals are assessed for COPD than would be otherwise. They point to other physiological threshold values (such as for blood pressure or blood sugar levels) that are also understood to have limitations, yet remain in widespread use. They also state that it makes it easier to compare results and prevalence statistics from different studies. In addition at least two studies have shown that there is a higher mortality of all individuals with an FEV1/FVC ratio below 70% regardless of whether or not they were below the FEV1/FVC LLN. Another study noted that in a large study population individuals with an FEV1/FVC ratio below 70% but above the LLN had a greater degree of emphysema and more gas trapping (as measured by CT scan), and more follow-up exacerbations than those below the LLN but above the 70% threshold.

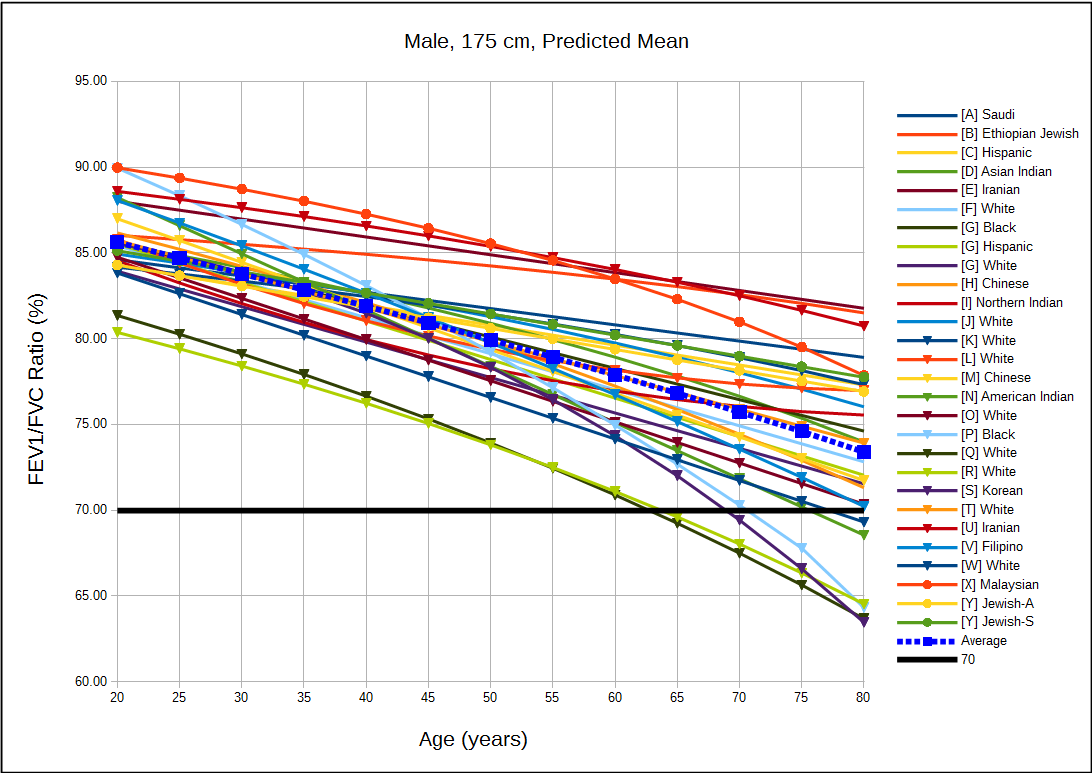
Since many of the LLN versus GOLD arguments are based on statistics it would be useful to look at the predicted FEV1/FVC ratios in order to get a sense of how much under- and over-estimation occurs with the 70% ratio. For this reason I graphed the predicted FEV1/FVC ratio from 54 different reference equations for both genders and a variety of ethnicities. Since a number of PFT textbooks have stated that the FEV1/FVC ratio is relatively well preserved across different populations what I initially expected to see was a clustering of the predicted values. What I saw instead was an exceptionally broad spread of values.

Male_175cm_Predicted

[more] Continue reading