2019 ATS/ERS Spirometry Standards

The 2019 ATS/ERS Spirometry Standards were recently released. The standards are open-access and can be downloaded without charge from the October 15th issue of the American Journal of Respiratory and Critical Care Medicine. Supplements are available from the same web page.

The 2019 Spirometry Standards have been extensively re-organized with numerous updates. Notably, a number of sections that were previously discussed in the 2005 General Considerations for Lung Function Testing have been updated and included in the 2019 Spirometry Standards. Also notably, a number of stand-alone spirometry tests, including the Flow-Volume Loop, PEF and MVV are not included in the 2019 Standards.

An overview of changes and updates from the 2005 Spirometry Standards are detailed within the 2019 Spirometry Standards (page e71, column 1, paragraph 2) and in the Data Supplement (pages E2-E3). In more detail these include:

◆ The list of indications for spirometry (page e73, table 1) was updated primarily with changes in language.

  • “To measure the effect of disease on pulmonary function” was updated to “To measure the physiological effect of disease or disorder”
  • “To describe the course of diseases that affect lung function” was updated to “To monitor disease progression”
  • “To monitor people exposed to injurious agents” was updated to “To monitor people for adverse effects of exposure to injurious agents”

◆ Items added to indications:

  • “Research and clinical trials”
  • “Preemployment and lung health monitoring for at-risk occupations”

◆ Contraindications were previously mentioned in the 2005 General Considerations rather than the 2005 Spirometry Standards and these have been extensively updated and expanded. Although the list of contraindications (page e74, table 2) is fairly inclusive (and should be reviewed by all concerned) there were items mentioned in the body of text that were not in the table:

  • “Spirometry should be discontinued if the patient experiences pain during the maneuver.”
  • “…because spirometry requires the active participation of the patient, inability to understand directions or unwillingness to follow the directions of the operator will usually lead to submaximal test results.”

◆ Notably, abdominal aortic aneurysm (AAA) was not included as a contraindication in the 2019 standards. (page e72, column 3, paragraph 1)

Continue reading
FEV1 and VC should be measured separately

The FEV1 and VC both provide quite different information about a patient’s lungs. Unfortunately, spirometry as it is currently practiced is optimized towards generating an accurate FEV1 more than an accurate VC. This is partly due to limitations in the maneuver itself and partly due to the lack of accurate end-of-test criteria for an adequate VC. In one sense this is okay since more than one person that I’ve known and respected has said that “it’s all about the FEV1”.

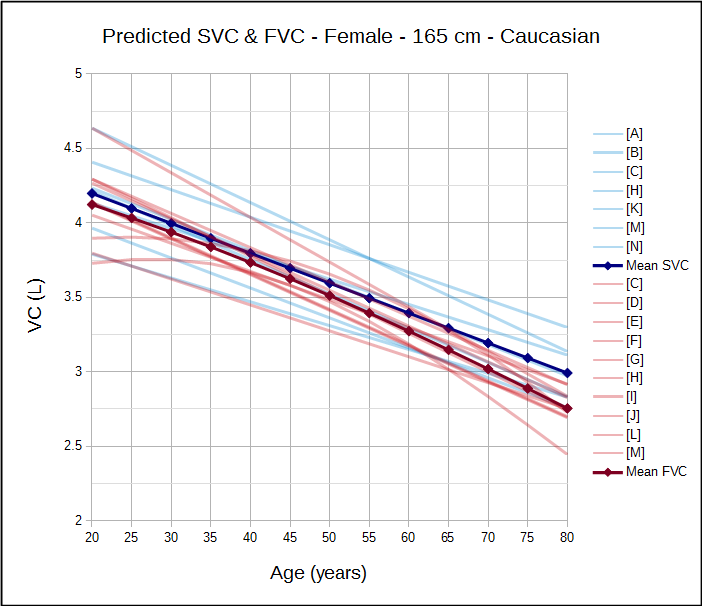
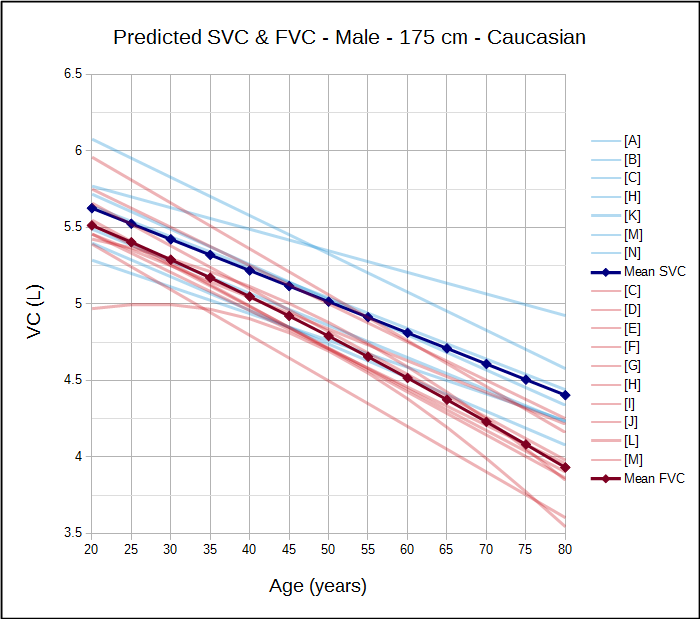
Having said that, an accurate FEV1/VC ratio is essential for detecting and quantifying airway obstruction and an SVC maneuver is more likely to obtain a more accurate VC. This matters because the current ATS/ERS spirometry guidelines recommend that the FEV1/VC be reported, where the VC is the largest value obtained from any test and reference equations indicate that the SVC is routinely larger than the FVC:

So, shouldn’t we be routinely performing both FVC and SVC maneuvers when we do spirometry on our patients? And why aren’t we?

Continue reading

A modest proposal for a clinical spirometry grading system

A while back I reviewed the spirometry grading system that was included in the 2017 ATS reporting standards. My feeling was, and continues to be, that its usefulness is very limited because it’s mostly a reproducibility grading system that relies on a few easy-to-measure parameters. This doesn’t mean that a grading system can’t be helpful, just that it needs to be focused differently.

In a clinical PFT lab many patients have difficulty performing adequate and reproducible spirometry, but that doesn’t mean the results aren’t clinically useful. Moreover, suboptimal quality results may be the very best the patient is ever able to produce. So what’s more important in a grading system than reproducibility is the ability to assess the clinical utility of a reported spirometry effort.

The two most important results that come from spirometry are the FEV1 and the FVC, and I strongly believe that they need to be assessed separately. For each of these values there are two aspects that need to be determined. First, is there a reliable probability that the reported value is correct? Second, are any errors causing the reported value to be underestimated or overestimated? The two are inter-related since a value with excellent reliability is not going to have any significant errors, but if there are errors then a reviewer needs to know which direction the result is being biased.

The current ATS/ERS standards contain specific thresholds for certain spirometry values such as expiratory time and back-extrapolation. Although these are certainly indications of test quality they are almost always used in a binary [pass | fail] manner. In order to assess clinical usefulness however, you instead need to grade these on a scale. For example an expiratory time of 5.9 seconds for spirometry from a 60 year-old individual would mean that there is a small probability that the FVC is underestimated, but with an expiratory time of 1.9 seconds the FVC would have a very high probability of being underestimated and this needs to be recognized in order to assess clinical utility.

Note: Although the A-B-C-D-F grading system is rather prosaic it is still universally understandable, so I will use it for grading reliability. An A grade or an F grade are probably easy to assign but differentiating between B-C-D may be more subjective, particularly since reliability depends on multiple parameters and judging their relative contribution is always going to be subjective at some point. For bias, I will be using directional characters (↑↓) to show the direction of the bias (i.e. positive or negative), so ↑ will indicate probable overestimation, ↓ will indicate probable underestimation, and ~ indicates a neutral bias.

FEV1 / Back extrapolation:

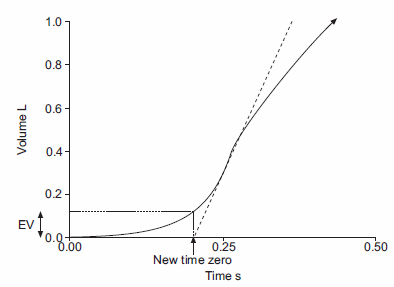
Back-extrapolation is a way to assess the quality of the start of a spirometry effort and the accuracy of the timing of the FEV1. The ATS/ERS statement says that the back-extrapolated volume must be less that 5% of the FVC or less than 0.150 L, whichever is greater.

My experience is that an elevated back-extrapolation tends to cause FEV1 to be overestimated far more often than underestimated. So a suggested grading system for back-extrapolation would be (and I’ll be the first to admit these are off the top of my head and open for discussion):

FEV1:    
Back-Extrapolation: Reliability: Bias:
Within standards: A ~
> 1 x standard, < 1.5 x standard: B
> 1.5 x standard, < 2 x standard C ↑↑
> 2 x standard, < 2.5 x standard: D ↑↑↑
> 2.5 x standard F ↑↑↑↑

Continue reading

Is gas trapping more common than we think it is?

Over the last couple of years I’ve run across a number of test systems that do not include tidal loops along with the maximal flow-volume loop. I’ve wondered why this was done and because of this I’ve thought a lot about tidal flow-volume loops and what additional information, if any, they add to spirometry interpretation.

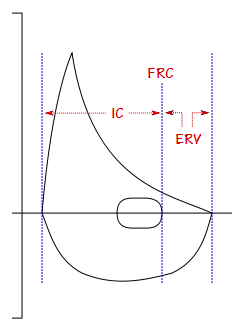
One of my thoughts has been about the relationship between obesity and the IC and ERV. FVC and TLC are often reasonably preserved even with relatively severe obesity. FRC, on the other hand, is often noticeably affected with even minor changes in BMI (and interestingly this applies to reduced as well as elevated BMI’s). When FRC decreases because of obesity the IC usually increases and the ERV decreases and for this reason the IC/ERV ratio has been suggested as a way to monitor changes in FRC without having to actually measure lung volumes.

IC and ERV are not measured as part of spirometry but the position of the tidal loops gives at least a general indication of their magnitude and I’ve noticed that there’s a moderately good correlation between BMI and the position of the tidal loop.

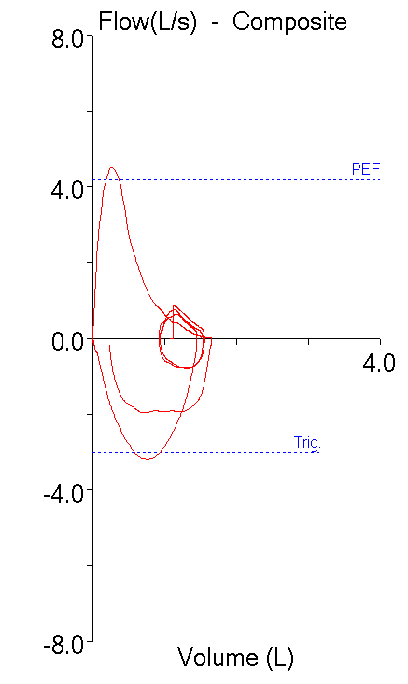
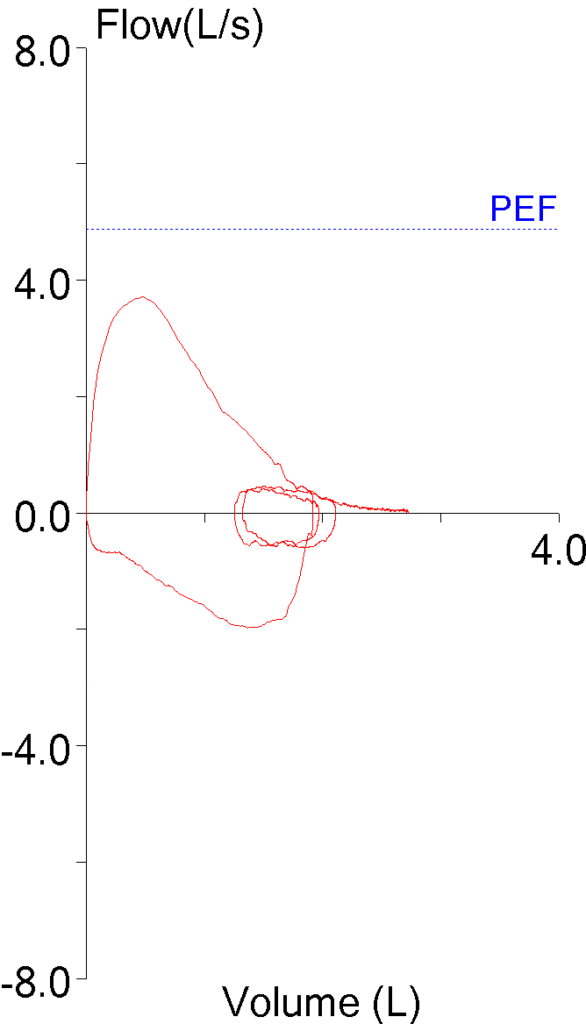
With this in mind, I see up to a dozen reports a week with restrictive-looking spirometry (i.e. symmetrically reduced FVC and FEV1 with a normal FEV1/FVC ratio) on patients with a diagnosis of asthma. This is nothing new and there have probably been at least 10 articles in the last decade about the Restrictive Spirometry Pattern (RSP). Interpreting these kinds of spirometry results is always problematic, particularly when there are no prior lung volume measurements to rule-in or rule-out restriction. I’ve noticed however, that patients with a restrictive spirometry pattern almost always have the tidal loop on the far right-hand side of the flow-volume loop (zero or near zero ERV). For example:

Observed: %Predicted:
FVC: 1.65 74
FEV1: 1.21 73
FEV1/FVC: 73 100

But there doesn’t seem to be any relationship between this observation and the patient’s BMI and in fact, this is seen even when BMI is normal or somewhat reduced. Continue reading

I’ve got the old back-extrapolation blues

A couple days ago I pulled my copy of the Intermountain Thoracic Society manual on pulmonary function testing off the bookshelf and thumbed through it a bit. It was first published in 1975 and was the first major attempt towards standardizing the performance and interpretation of PFTs.

My first thought was that we’ve come a long way since then. Most importantly our understanding of what spirometry can (and cannot) tell us has improved dramatically.

Equipment too, has advanced since 1975, most particularly due to the first equipment standards that were published in that decade. As a reminder, spirometer accuracy was not a given and there are number of studies dating from that time period that detailed just how woefully inaccurate many of them were.

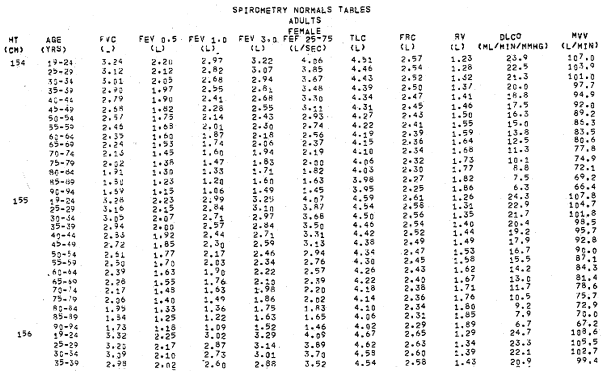
In 1975 computerized spirometers were exceptionally rare and I was reminded of this because 141 pages (two-thirds!) of the ITS manual is filled with look-up tables for predicted values and ATPS – BTPS – STPD conversion factors.

Most spirometry systems were entirely manual and the majority of us measured FVC and FEV1 manually from pen tracings on kymograph paper. The results were then hand-calculated and then hand-written onto report forms. Since our equipment is so much more accurate and our computers acquire and calculate test results automatically, everything is so much better now, isn’t it?

Overall, I’d have to say yes. Testing is much quicker and more accurate than it used to be in 1975, and no, I’m not particularly nostalgic about those days.

{Arrrhh, gather round lads and lasses and let me tell you of the days when coal-fired steam-powered spirometers rumbled and hissed in basement labs everywhere; when you had to solve regression equations with your slide rule on the fly or risk the horror of ripped kymograph paper, exploding alveolar sample bags and spirometer bells gone ballistic without warning. The toll this daily physical and mental trauma took amongst the lowly pulmonary techs was terrifying and only the bravest continued the daily battle against gnarly patients, sneering doctors, black-hearted administrators and monopolistic manufacturers…

…Oops! Wrong time-line; those are memories from the universe one north and two left of ours. Too much steampunk sci-fi late at night and too little sleep left me momentarily confused}

I ran across an error today that reminded me that although computerized test systems are essential to our ability to run efficient and accurate labs, at the same time the limitations of software that comes along with them hinders our ability to detect and correct errors.

Continue reading

Thinking about the past

This is the time of the year when it’s traditional to review the past. That’s what “Auld lang syne”, the song most associated with New Year’s celebrations, is all about. I too have been thinking about the past but it’s not been about absent friends, it’s been about trend reports and assessing trends.

In the May 2017 issue of Chest, Quanjer et al reported their study on the post-bronchodilator response in FEV1. I’ve discussed this previously and they noted that the current ATS/ERS standard for a significant post-bronchodilator change of ≥12% and ≥200 ml penalized the short and the elderly. Their finding was that a significant change was better assessed by the absolute change in percent predicted (i.e. 8%) rather than a relative change.

I’ve thought about how this could apply to assessing changes in trends ever since then. The current standards for a significant change in FEV1 over time (also discussed previously) is anything greater than:

which is good in that it is a way to reference changes over any arbitrary time period but it also looks at it as a relative change (i.e. ±15%). A 15% change however, comes from occupational spirometry, not clinical spirometry, and the presumption, to me at least, is that it’s geared towards individuals who have more-or-less normal spirometry to begin with.

A ±15% change may make sense if your FEV1 is already near 100% of predicted but there are some problems with this for individuals who aren’t. For example, a 75 year-old 175 cm Caucasian male would have a predicted FEV1 of 2.93 L from the NHANESIII reference equations. If this individual had severe COPD and an FEV1 of 0.50 L (17% of predicted), then a ±15% relative change in FEV1 would ±0.075 L (75 ml). That amount of change is half the acceptable amount of intrasession repeatability (150 ml) in spirometry testing and it’s hard to consider a change this small as anything but chance or noise. It’s also hard to consider this a clinically significant change. Continue reading

Assessing post-BD improvement in FEV1 and FVC as a percent of the predicted

The 2005 ATS/ERS standards for assessing post-bronchodilator changes in FVC and FEV1 have been criticized numerous times. A recent article in the May issue of Chest (Quanjer et al) has taken it to task on two specific points:

  • the change in FVC and FEV1 has to be at least 200 ml
  • the change is assessed based on the percent change (≥12%) from the baseline value

The article points out that the 200 ml minimum change requires a proportionally larger change for a positive bronchodilator response in the short and the elderly. Additionally, by basing the post-BD change on the baseline value it lowers the threshold (in terms of an absolute change) for a positive bronchodilator response as airway obstruction become more severe. As a way of mitigating these problems the article recommends looking at the post-bronchodilator change as a percent of predicted rather than as a percent of baseline.

The article is notable (and its authors are to be commended) because it studied 31,528 pre- and post-spirometry records from both clinical and epidemiological sources from around the world. For the post-bronchodilator FEV1 and FVC:

  • the actual change in L
  • the percent change from baseline
  • the change in percentage of predicted
  • the Z-score

were determined.

Continue reading

Normal or obstruction?

I had finished reviewing a pre- and post-BD spirometry report yesterday and was about to toss it on my out pile when I noticed something a bit odd about the post-BD results. I pulled it back and spent some time trying to decide if the interpretation needed to be changed but after a lot of internal debate I finally let it go as it was. I’ve continued to think about it however, and although I’m not sure that was the right decision I still haven’t come up with a clear answer.

Here’s what I saw:

Observed: %Predicted: Post-BD: %Predicted: %Change:
FVC: 3.70 97% 3.91 103% +6%
FEV1: 2.82 94% 2.79 93% -1%
FEV1/FVC: 76 95% 71 89% -6%
PEF: 6.62 94% 7.19 102% +9%
Exp. Time: 10.92 11.15

The reported pre-BD and post-BD results were from good quality tests and met the criteria for repeatability. My problem is that the baseline results were normal but if I had seen the post-BD results by themselves I would have considered them to show mild airway obstruction.

Continue reading

Is there airway obstruction when the FEV1 is normal?

I’ve been reviewing the literature on PFT interpretation lately and in doing so I ran across one of the issues that’s bothered me for a while. Specifically, my lab has been tasked with following the 2005 ATS/ERS guidelines for interpretation and using this algorithm these results:

Observed: %Predicted: LLN: Predicted:
FVC: 2.83 120% 1.76 2.36
FEV1: 1.77 100% 1.26 1.76
FEV1/FVC: 63 84% 65 75

would be read as mild airway obstruction.

Although it’s seems odd to have to call a normal FEV1 as obstruction I’ve been mostly okay with this since my lab has a number of patients with asthma whose best FVC and FEV1 obtained at some point in the past were 120% of predicted or greater but whose FEV1 frequently declines to 90% or 100% of predicted. In these cases since prior studies showed a normal FEV1/FVC ratio then an interpretation of a mild OVD is probably correct even though the FEV1 itself is well above the LLN, and this is actually the situation for this example.
Continue reading

Estimated Lung Age (ELA)

Cigarette smoking raises the probability that an individual will get lung cancer, chronic bronchitis and/or emphysema (among many other things). Nicotine is addictive and smokers often need significant motivation in order to quit. Lung age is a tool that was designed to give smokers an additional incentive to do this. The concept is fairly simple and that is by reformulating an FEV1 reference equation it is possible to take an individual’s actual FEV1 and estimate the age of their lungs (ELA). Because cigarette smoking can cause airway obstruction it tends to mimic premature lung aging which means that when a smoker’s FEV1 is used to calculate an ELA it can be significantly greater than their real or chronological lung age (CLA).

This idea was first proposed by Morris and Temple in 1985. Using Morris et al’s 1971 spirometry reference equations they studied the effect of calculating an estimated lung age (ELA) using observed FVC, FEV1 and FEF25-75 values both singly and in combinations and found that the FEV1 had the lowest standard error. The ELA calculation based on Morris et al’s FEV1 reference equations has achieved a degree of popularity and is available on at least one personal spirometer (Pulmolife, sold by Carefusion, MDSpiro and Vitalograph) and as an on-line calculator from a couple different websites (Chestx-ray.com and Lung Foundation of Australia).

Interestingly, the effectiveness of ELA towards quitting smoking has been studied only a handful of times. One often-quoted study of smoking cessation (Parkes et al) saw double the quit rate (13.6% vs 6.4%) when ELA was used as an intervention but the study’s methodology has since been criticized and it’s results have not been duplicated.

Continue reading