The dual tracer gas single-breath washout (DTG-SBW) and ventilation inhomogeneity

I’ve been interested in ventilation inhomogeneity for a while and as ways to measure it I have looked at VA/TLC ratios, the Lung Clearance Index (LCI) and the phase III slope of the single-breath N2 washout (SIIIN2). All of these tests are able to provide some information about ventilation inhomogeneity but each has their own limitations and just as importantly although their results have a relatively clear relationship with ventilation inhomogeneity it’s not quite as clear what exactly it is they are measuring. A friend recently pointed me to an on-line article in Chest that discusses the dual-tracer single-breath washout test in patients with COPD. The apparent advantage of this test is that it is able to provide information about the site of the ventilation inhomogeneity. Although dual tracer gases have been used to study airway function for over 50 years the limitation of this technique has been the need to use a mass spectrometer. Some recent advances in technology have made it possible for this type of testing to be performed with a significantly less expensive gas analyzer and this has revived an interest in the dual-tracer gas single-breath washout (DTG-SBW).

The two tracer gases in question are Helium and Sulfur Hexaflouride (SF6). Helium has a density of 4 gm/mol and the density of SF6 is 146 gm/mol, and it is the difference in densities between these two inert and insoluble gases that make this test useful. In order to understand why we need to revisit to the anatomy of the terminal airways.

From Osborne S. Airway resistance and airflow through the tracheobronchial tree. www.SallyOsborne.com.

From Osborne S. Airway resistance and airflow through the tracheobronchial tree. www.SallyOsborne.com.

Continue reading

Why DIY CPET reports?

When I first started performing CPETs in the 1970’s a patient’s exhaled gas was collected at intervals during the test in Douglas bags and I had a worksheet that I’d use to record the patient’s respiratory rate, heart rate and SaO2. After the test was over I’d analyze the gas concentrations with a mass spectrometer and the gas volumes with a 300 liter Tissot spirometer and then use the results from these to hand calculate VO2, VCO2, Rq, tidal volume and minute volume. These results were then passed on to the lab’s medical director who’d use them when dictating a report.

Around 1990 the PFT lab I was in at the time acquired a metabolic cart for CPET testing. This both decreased the amount of work I had to do to perform a CPET and significantly increased the amount of information we got from a test. The reporting software that came with the metabolic cart however, was very simplistic and neither the lab’s medical director or I felt it met our needs so I created a word processing template, manually transcribed the results from the CPET system printouts and used it to report results.

Twenty five years and 3 metabolic carts later I’m still using a word processing template to report CPET results.

Why?

Well, first the reporting software is still simplistic and using it we still can’t get a report that we think meets our needs (and it’s also not easy to create and modify reports which is a chronic complaint I have about all PFT lab software I’ve ever worked with). Second, there are some values that we think are important that the CPET system’s reporting software does not calculate and there is no easy way to get it on a report as part of the tabular results. Finally, and most importantly, I need to check the results for accuracy.

You’d think that after all these years that you wouldn’t need to check PFT and CPET reports for mathematical errors but unfortunately that’s not true. For example, these results are taken from a recent CPET:

Time: VO2 (LPM): VCO2 (LPM): Reported Rq: “Real” Rq:
Baseline: 0.296 0.220 0.74 0.74
00:30 0.302 0.214 0.77 0.71
01:00 0.363 0.277 0.77 0.76
01:30 0.395 0.306 0.78 0.77
02:00 0.424 0.353 0.99 0.83
02:30 0.459 0.403 0.92 0.88
03:00 0.675 0.594 0.89 0.88
03:30 0.618 0.584 0.94 0.94
04:00 0.836 0.822 1.00 0.98

Continue reading

The FVC/DLCO ratio. Will the real percent predicted please stand up?

Recently a reader asked me a question about the FVC/DLCO ratio. To be honest I’d never heard of this ratio before which got me intrigued so I spent some time researching it. What I found leaves me concerned that a lack of understanding about reference equations may invalidate several dozen interrelated studies published over the last two decades.

Strictly speaking the FVC/DLCO ratio is the %predicted FVC/%predicted DLCO ratio (which is usually abbreviated FVC%/DLCO%) and it appears to be used exclusively by specialists involved in the treatment of systemic sclerosis and related disorders. Specifically, the ratio is used to determine whether or not a patient has pulmonary hypertension. The basic idea is that (quoting from a letter to the editor):

“As we know, in ILD both FVC and DLCO fall and their fall is proportionate, whereas in pulmonary arterial hypertension DLCO falls significantly and disproportionately to FVC.”

A variety of algorithms using the FVC%/DLCO% have been devised. Inclusion factors are usually an FVC < 70% of predicted and a DLCO (corrected for hemoglobin) < 60% of predicted. A number of different threshold values for FVC%/DLCO% have been published ranging from 1.4 to 2.2 with the differences appearing to be dependent on study population characteristics and the type of statistical analysis performed. It is thought that individuals meeting the inclusion factors with an FVC%/DLCO% ratio above the threshold most probably have pulmonary hypertension.

Continue reading

When no change is a change, or is it?

I was reviewing a spirometry report last week and when I went to compare the results with the patient’s last visit I noticed that the FVC and FEV1 hadn’t changed significantly. However, the previous results were from 2009 and when the percent predicted is considered there may have been a significant improvement.

2009 Observed: %Predicted:
FVC: 2.58 87%
FEV1: 1.60 72%
FEV1/FVC: 62 82%
2016 Observed: %Predicted:
FVC: 2.82 104%
FEV1: 1.65 82%
FEV1/FVC: 59 79%

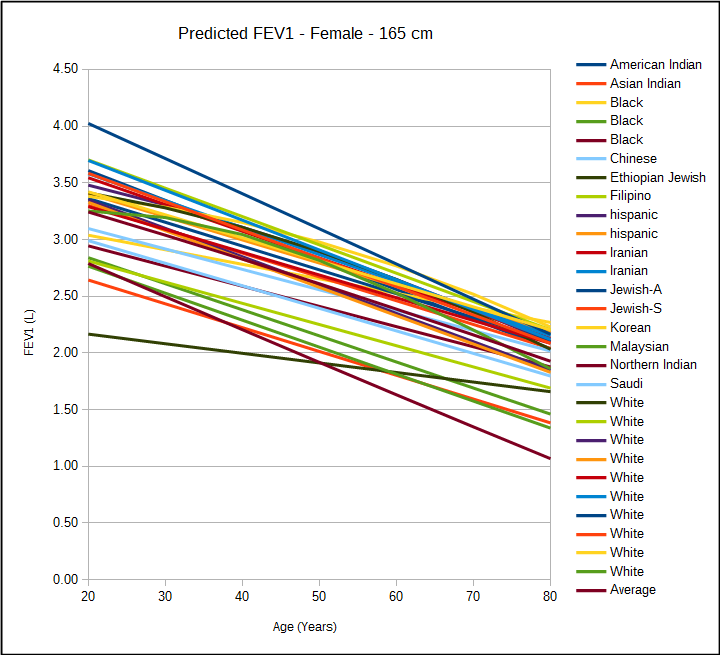
The answer to whether or not there was an improvement would appear to depend on what changes you’d normally expect to see in the FVC and FEV1 over a time span of 7 years. The FVC and FEV1 normally peaks around age 20 to 25 and then declines thereafter.

fvc_predicted_l

fev1_predicted_l

[more] Continue reading