Top 10 spirometry errors and mistakes

A couple of days ago my medical director and I had a short discussion about teaching pulmonary fellows to read PFTs and agreed that in order to be good at interpreting PFTs it isn’t the basic algorithms that are hard, it’s gaining an understanding of test quality and testing problems. My medical director then suggested this topic. At first I wasn’t sure I could find 10 errors but after spending a couple hours digging through my teaching files I managed to come up with just a few more than that. So strictly speaking it’s not a top 10 list but I kept the title because I liked it.

Spirometry errors and mistakes seem to fall into four categories: demographics, reference equations, testing and interpretation.

Demographics:

Normal values are based on an individual’s age, height and gender. When this information is entered incorrectly the normal reference values will also be incorrect. These errors often go uncaught because whoever reviews and interprets reports usually isn’t the same person who sees the patient and performs the tests. This type of error often doesn’t get corrected until the results are uploaded into a hospital information system or the patient returns for a second (or third or fourth) visit.

1. Wrong gender.

Pulmonary function reference equations are gender specific and for individuals with the same age and height, men will have a larger FVC and FEV1 than women do. When a patient’s demographics information is manually entered into a PFT system it’s always possible for somebody to enter the wrong gender. When this happens the predicted values will be either over- or under-estimated. This happens in my lab at least a half a dozen times a year and it’s why when I review reports I try to check the patient’s gender right after reading their name.

This is also a problem area for individuals who have gone through gender reassignment (transsexuals). An individual’s physiologic/developmental gender needs to be used to generate predicted values but this may be at odds with their gender recorded in a hospital’s information system. Some PFT lab systems populate their demographics information from their hospital’s information system when an order is received and it may or may not be possible to alter gender once this has happened. In other cases, an individual’s demographics may be cross-referenced when PFT results are uploaded into hospital information system and may throw an error if the wrong gender is present.

2. Wrong height

All lung volumes and capacities scale with height. Like any other manual entry height can be mis-entered and the most common error I’ve seen is for somebody to enter 60 inches when they meant 6 feet 0 inches.

Height can also be mis-measured if the patient isn’t asked to remove their shoes or to stand straight, or if the patient is asked for their height and it isn’t even measured. An error of an inch or two probably won’t make a big difference in a patient’s predicted values (particularly given the discrepancies between different reference equations) but for somebody who’s on the edge of normal and abnormal it can make a significant difference in how a report is interpreted.

Continue reading

Which DLCO should be reported?

I like to think my lab is better than most but every so often something comes along that makes me realize I’m probably only fooling my self.

Earlier this week I was reviewing the DLCO test data for a patient with interstitial lung disease. At first glance the spirometry and DLCO results pretty much matched the diagnosis and I had already seen they weren’t significantly different from the last visit. The technician had written “fair DLCO reproducibility” which was reason enough to review the test data but I’ve actually been making a point of taking a careful look at all DLCO tests, not just the questionable ones, for the last couple of weeks. I took one look at the test data, put my head in my hands, and counted to ten before continuing.

Reported: %Predicted: Test #1: Test #2: Test #3:
DLCO: 13.22 66% 10.08 92.17 16.36
Vinsp (L): 2.17 2.20 2.15
VA (L): 3.45 66% 2.89 2.93 4.02
DL/VA: 3.78 91% 3.49 31.5 4.07
CH4: 60.84 60.94 43.15
CO: 34.46 0.51 23.13

Even though the averaged DLCO results were similar to the last visit, the two tests they were averaged from were quite different. Reproducibility was not fair, it was poor. But far more than that, something was seriously wrong with the second test and the technician hadn’t told anybody that they’d had problems with the test system. {SIGH}. It’s awful hard to fix a problem when you don’t even know there is one in the first place.

I usually review reports in the morning the day after the tests have been performed, so the patient was long gone by the time I saw the results. This left me with a problem that I’m sure we’ve all had at one time or another and that was whether any of the DLCO results were reportable.
Continue reading

When is a change in FVC significant?

Most of the COPD patients that are seen in my lab tend to have little change in their FEV1 from visit to visit but their FVC often changes significantly. A change in FVC is usually related to how long a patient is able to exhale and this in turn is usually related to how well they are feeling at the time. This would seem to imply that a significant change in FVC, particularly for a patient with COPD, is, if not clinically significant, at least clinically important even when the FEV1 hasn’t changed.

The problem with this is that expiratory time can be affected by things other than how the patient is feeling. Dyspnea and fatigue, of course. As importantly some technicians are better at motivating patients than other technicians so it can also be related to which technician is performing their tests. Even when the same technician is involved however, there is no guarantee that the level of motivation or a patient’s response to that motivation will be the same.

So how do you know if a change in FVC clinically significant or not?

Recently a spirometry report from a patient with very severe COPD came across my desk. When comparing the results to those of the last visit I could see that there had been a small (but not significant) increase in FEV1 but at the same time there had been a large (and significant) increase in FVC.

Visit 1: Observed: %Predicted:
FVC (L): 1.28 36%
FEV1(L): 0.53 19%
FEV1/FVC: 41 53%
Visit 2: Observed: %Predicted:
FVC (L): 1.93 55%
FEV1(L): 0.60 22%
FEV1/FVC: 31 40%

Continue reading

Six-Minute Walk with Helium-Oxygen

We recently performed a 6-minute walk test with helium-oxygen (heliox) for a patient of one of the physicians that specializes in airway stenting. His reasons for the test weren’t particularly clear (and he hasn’t bothered to try to clarify them with me) but most probably it has to do with differentiating between central and peripheral airway obstruction. Interestingly, he predicted the patient would have a significant improvement in 6-minute walk distance and instead there was little difference between the heliox 6MWT and one performed with 3 LPM supplemental O2.

6MWT: SaO2: Distance:
80% Helium – 20% O2, by mask 95% 440 meters
3 LPM O2, by nasal cannula 98% 457 meters

Helium is an inert, insoluble, low mass gas and both its therapeutic use and its use in physiological measurements has to do with it’s low density (and the fact that it’s highly insoluble, but that’s for purposes different than those discussed here).

  Density (g/m3)
He 0.179
N2 1.251
O2 1.429
Air (78% N2, 21% O2) 1.293
Heliox (80% He, 20% O2) 0.429

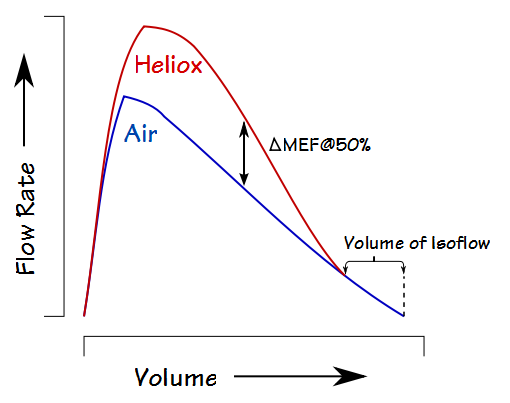
A typical way to assess its effect is by comparing air and heliox flow-volume loops:

heo2_fvl

Interestingly, despite an apparent increase in flow rates there is usually no significant difference in FEV1 (one study showed a range of +2% to +7% in a group of over 1500 subjects). The most common heliox FVL measurements are the change in expiratory flow at 50% of the FVC (ΔMEF@50%) and the Volume of Isoflow (which is the point at which the air and heliox expiratory flows become equivalent). Many of the earlier studies with heliox also measured ∆MEF@75% and ∆FEF25-75, and a tiny handful of studies (particularly given the technical difficulties) have measured ∆RAW and ∆sGAW.
Continue reading