Selecting the best FEV1. What role should PEF play?

Recently my lab has had some turnover with a couple of older staff leaving and new staff coming on board. While reviewing reports I’ve found a number of instances where the incorrect FVC and FEV1 were reported. Taking these as “teachable moments” I’ve been annoying the staff with emails whenever I find something notably wrong. I had thought that our rules for selecting the best FVC and FEV1 were fairly straightforward but given the number of corrections I’ve made lately it seemed like it would be a good idea to revisit our policy on this subject.

The process I’ve used for selecting the best FVC and FEV1 has evolved over the years. Initially I was told to select the single spirometry effort that had the largest combined FVC and FEV1. Later on test quality became a factor (not that is wasn’t in the beginning but there aren’t a lot of quality indicators for a pen trace on kymograph paper). How to juggle the different quality rules wasn’t altogether clear however (they seemed to change a bit with whichever physician was reviewing PFTs at the time), and I was still supposed to somehow select just a single spirometry effort.

Most recently this was simplified by only having to select the largest FVC (regardless of test quality) from any spirometry effort and then the largest FEV1 as long as it came from a spirometry effort with good quality. This is pretty much in accord with the ATS/ERS spirometry standards but with one important difference, and that is that we use use Peak Expiratory Flow (PEF) as an indicator of test quality.

Strictly speaking the ATS/ERS standards state that

“The largest FVC and the largest FEV1 (BTPS) should be recorded after examining the data from all of the usable curves, even if they do not come from the same curve.”

There are, of course, a number of quality indicators for spirometry efforts that are used to indicate whether a curve is “usable”. These include things like back-extrapolation, expiratory time, terminal expiratory flow rate and repeatability but the one thing they do not include is PEF.

Despite not being within the ATS/ERS standards the reason that we use PEF in the selection process is found in the phrase “maximal forced effort” that is part of the ATS/ERS definition for FVC and FEV1. It has long been recognized (certainly since the early 1980’s and most likely earlier) that the FVC and FEV1 from a submaximal spirometry effort were often higher than the FVC and FEV1 from a maximal effort. So, is the largest FEV1 correct (as long as it meets the basic ATS/ERS criteria) or should it be the FEV1 from the effort with the highest PEF?

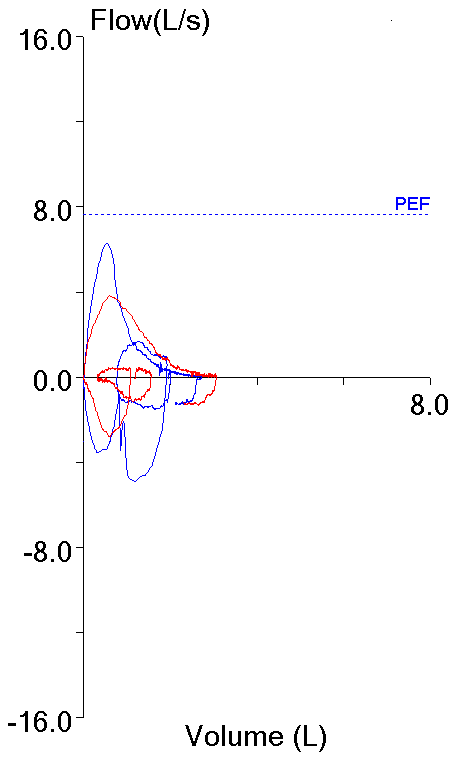
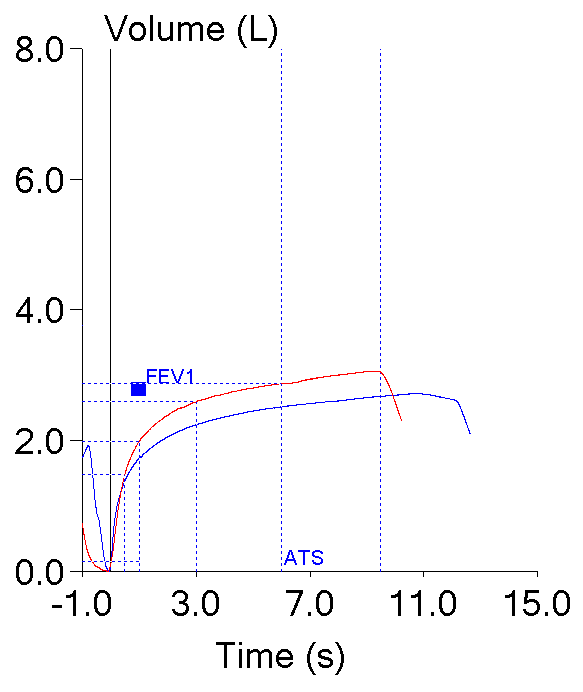
These two efforts from the same patient testing session highlight this dilemma. Both meet the ATS/ERS criteria for the start of the test which is what primarily applies to FEV1 (and PEF).

FEV1_vs_PEF_FVL

FEV1_vs_PEF_V-T

Blue: Red:
FVC (L): 2.72 3.06
FEV1 (L): 1.73 1.99
PEF (L/sec): 6.28 3.82

Continue reading

A change that probably isn’t a change

Recently a report came across my desk from a patient being seen in the Tracheomalacia Clinic. The clinic is jointly operated by Cardio-Thoracic Surgery and Interventional Pulmonology and among other things they stent airways. The patient had been stented several months ago and this was a follow-up visit. Given this I expected to see an improvement in spirometry, which had happened (not a given, BTW, some people’s airways do not tolerate stenting), but what I didn’t expect to see was a significant improvement in lung volumes and DLCO.

When I took a close look at the results however, it wasn’t clear to me that there really had been a change. Here’s the results from several months ago:

Observed: %Predicted: Predicted:
FVC: 1.19 50% 2.38
FEV1: 0.64 35% 1.79
FEV1/FVC: 53 71% 76
TLC: 3.21 76% 4.22
FRC: 2.34 96% 2.43
RV: 2.11 113% 1.85
RV/TLC: 66 150% 44
SVC: 1.15 48% 2.37
IC: 0.87 48% 1.80
ERV: 0.25 41% 0.58
DLCO: 6.59 38% 16.18
VA: 1.78 43% 4.12
IVC: 1.04

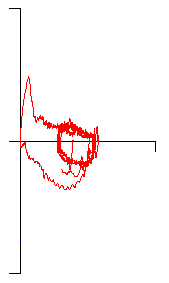
Change_that_isnt_change_2015_FVL_redacted_2

[more] Continue reading

COPD and the FEV1/FVC ratio. GOLD or LLN?

Everyone uses the FEV1/FVC ratio as the primary factor in determining the presence or absence of airway obstruction but there are differences of opinion about what value of FEV1/FVC should be used for this purpose. Currently there are two main schools of thought; those that advocate the use the GOLD fixed 70% ratio and those that instead advocate the use the lower limit of normal (LLN) for the FEV1/FVC ratio.

The Global Initiative for Chronic Obstructive Lung Disease (GOLD) has stated that a post-bronchodilator FEV1/FVC ratio less than 70% should be used to indicate the presence of airway obstruction and this is applied to individuals of all ages, genders, heights and ethnicities. The official GOLD protocol was first released in the early 2000’s and was initially (although not currently) seconded by both the ATS and ERS. The choice of 70% is partly happenstance since it was one of two fixed FEV1/FVC ratio thresholds in common use at the time (the other was 75%) and partly arbitrary (after all why not 69% or 71% or ??).

The limitations of using a fixed 70% ratio were recognized relatively early. In particular it has long been noted that the FEV1/FVC ratio declines normally with increasing age and is also inversely proportional to height. For these reasons the 70% threshold tends to over-diagnose COPD in the tall and elderly and under-diagnose airway obstruction in the short and young. Opponents of the GOLD protocol say that the age-adjusted (and sometimes height-adjusted) LLN for the FEV1/FVC ratio overcomes these obstacles.

Proponents of the GOLD protocol acknowledge the limitation of the 70% ratio when it is applied to individuals of different ages but state that the use of a simple ratio that is easy to remember means that more individuals are assessed for COPD than would be otherwise. They point to other physiological threshold values (such as for blood pressure or blood sugar levels) that are also understood to have limitations, yet remain in widespread use. They also state that it makes it easier to compare results and prevalence statistics from different studies. In addition at least two studies have shown that there is a higher mortality of all individuals with an FEV1/FVC ratio below 70% regardless of whether or not they were below the FEV1/FVC LLN. Another study noted that in a large study population individuals with an FEV1/FVC ratio below 70% but above the LLN had a greater degree of emphysema and more gas trapping (as measured by CT scan), and more follow-up exacerbations than those below the LLN but above the 70% threshold.

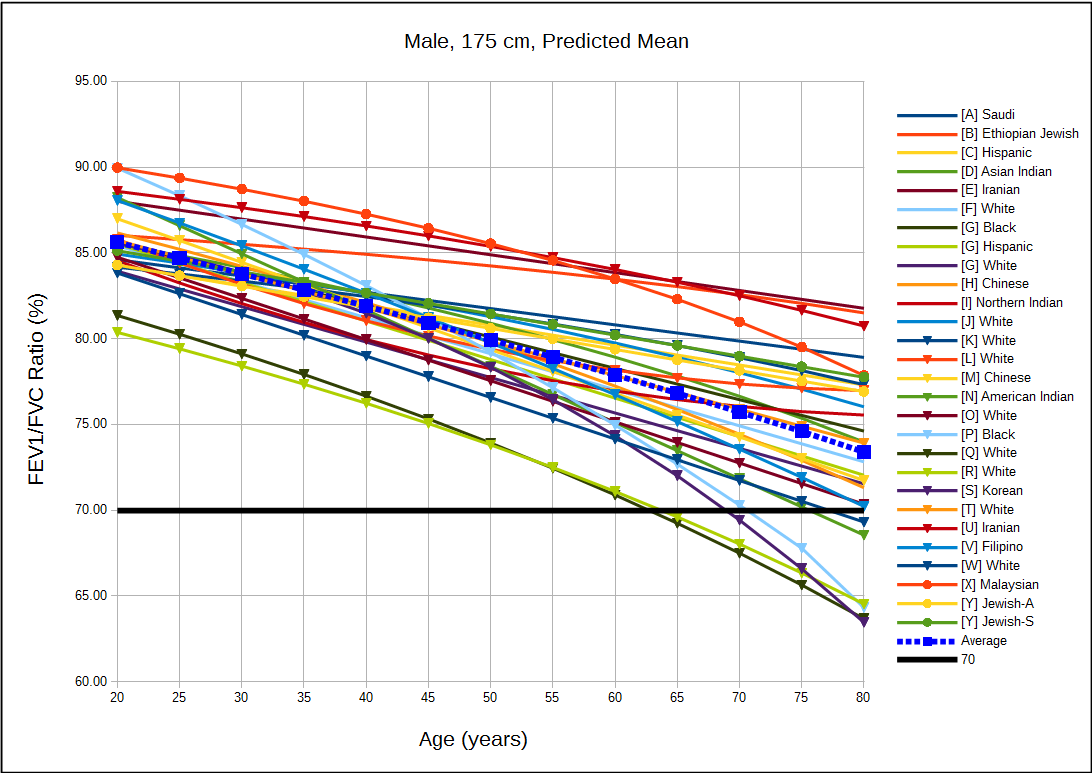
Since many of the LLN versus GOLD arguments are based on statistics it would be useful to look at the predicted FEV1/FVC ratios in order to get a sense of how much under- and over-estimation occurs with the 70% ratio. For this reason I graphed the predicted FEV1/FVC ratio from 54 different reference equations for both genders and a variety of ethnicities. Since a number of PFT textbooks have stated that the FEV1/FVC ratio is relatively well preserved across different populations what I initially expected to see was a clustering of the predicted values. What I saw instead was an exceptionally broad spread of values.

Male_175cm_Predicted

[more] Continue reading

A glitch in time

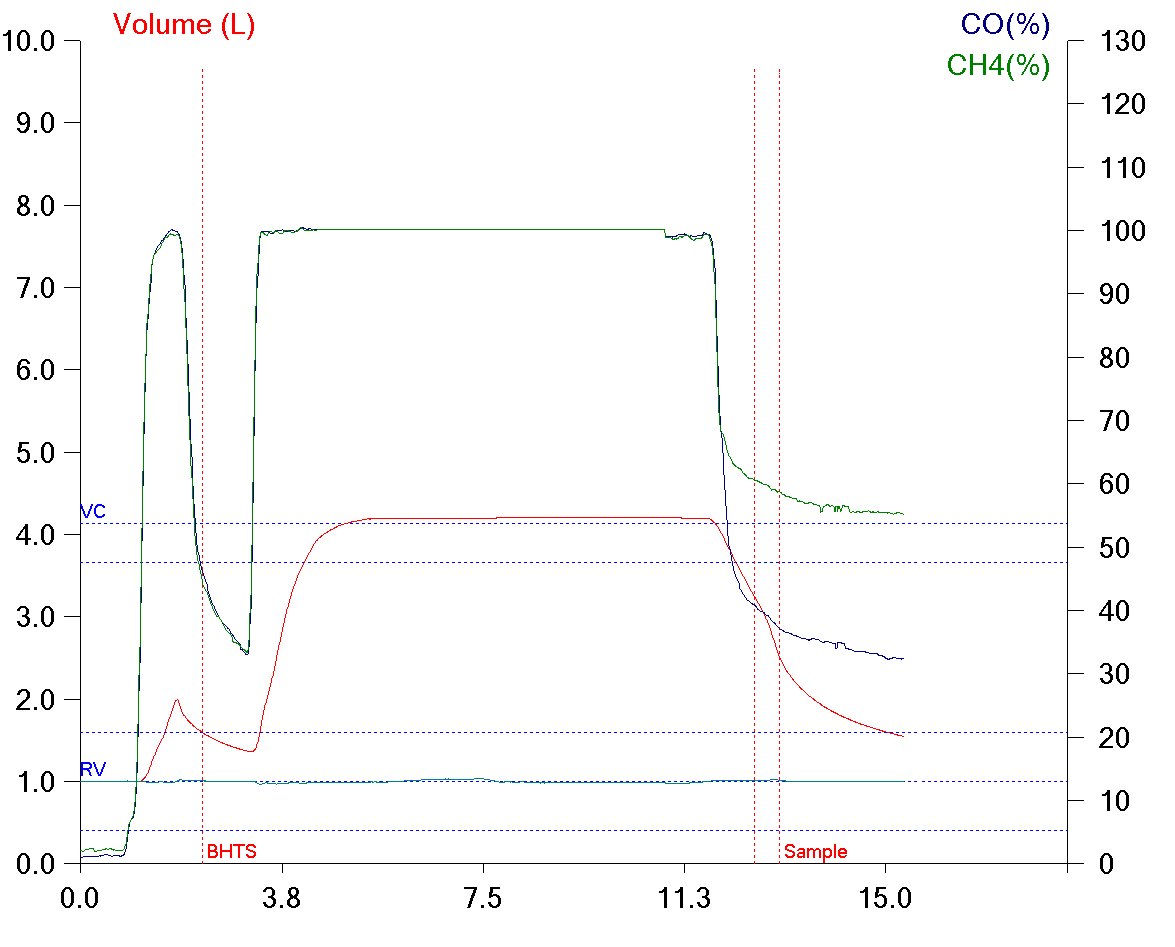
This relatively odd DLCO testing error came across my desk today. Although it’s fairly unusual it brings up some interesting points about how the Breath-Holding Time (BHT) is determined and what effect it has on DLCO.

Specifically, at the beginning of the DLCO test the patient took a partial breath in, then exhaled, then took a complete breath in. The patient performed the DLCO test three times and did exactly the same thing each time despite being coached by the technician to only take a single breath in. I’m sure this says something about human nature but I’m not exactly sure what.

BHT_Glitch_1

Anyway, our test systems uses the Jones-Meade approach to measuring breath-holding time (the ATS/ERS recommendation). The J-M algorithm starts the measurement of BHT when the inhalation has reached 1/3 of the inspiratory time. In this case the computer detected the beginning of the first inspiration and detected when the patient had reached the end of inspiration (which is standardized at the point at which 90% of the final inhaled volume has been reached), but it ignored what happened in the middle. For this reason, the software set the beginning of the breath-holding time before the “real” inhalation.

Continue reading