The ratio-nal approach to predicted TLC

I’ve been reading Miller et al’s Laboratory evaluation of Pulmonary Function which was published in 1987. That was an interesting time since PFT equipment manufacturers had mostly transitioned to computerized systems but there were still a lot of manual systems in the field. For this reason the book’s instructions are still oriented mostly around manual pulmonary function testing and there are numerous warnings about double-checking the results from automated systems.

The book includes extensive discussion on the calculations and formulas used for testing which makes it useful as a teaching resource. The authors were also very concerned about the correct way to run a PFT lab so there is a fair amount of discussion about staff requirements for education and training (including the medical director) and staff behavior and conduct. To this end each chapter includes extensive instructions on the proper way to perform tests and treat patients. Although the tone of this is somewhat dated and I’d like to say these kind of reminders shouldn’t be necessary, it doesn’t hurt to set a standard on the level of professionalism we should aspire to.

What caught my eye though, was a section in the chapter on Normal Values titled Interdependence of Normal Values which discussed of the value of deriving predicted TLC from predicted FVC. The authors were concerned that reference equations for different tests (and not just lung volumes) were being selected without concern for how well they fit together. I’ve previously written about the problems that results when inserting the reference equation for FVC into the reference equations for lung volumes. In one instance, the TLC was adjusted so that the final predicted TLC was equal to RV + VC, but this meant that TLC (and IC) were changed from the original reference equations. In another, the FVC was just substituted for SVC without adjustment which meant that RV + VC was not equal to TLC and IC + ERV was not equal to VC and this makes interpreting results problematic. What this means however, is that almost 30 years after this was published, this problem is still around.

As a solution, the authors point out that ratios, such as the FEV1/FVC ratio and the RV/TLC ratio tend to be relatively independent of height.

Since:

TLC = FVC + RV

This can be mathematically re-written as:

Which means that TLC can be derived from predicted FVC if the RV/TLC ratio is known.

Continue reading

Underutilized spirometry, missed opportunities

A friend is taking her father to a PFT lab (2500 miles away from where I am the moment so I couldn’t go along with them) because he has been short of breath for a couple of years, but oddly enough, only when lying on his side. I expect that despite these rather specific symptoms he will only get routine spirometry. I don’t necessarily fault the PFT Lab he’s going to for this, partly because physician orders often don’t include specifics, partly because they may not have the facilities to perform supine or lateral spirometry, and partly because its not clear lateral spirometry would show anything.

I don’t think that my lab is necessarily any better. We have only one room with an exam table that allows us to perform positional spirometry and that is largely because of the ALS patients we regularly see. Even so, unless we received specific orders to perform supine or lateral spirometry it’s unlikely that one of our technicians would think it was necessary and then take it on themselves to perform it. That itself is part of the problem not only for my lab but for the field of Pulmonary Function testing in general (but that’s another story).

The real problem however, is that the way in which spirometry is performed around the world is focused almost exclusively on detecting expiratory airway obstruction. It may be true that airway obstruction is primarily expiratory, but this ignores that fraction of individuals who have some degree of inspiratory obstruction. It also overlooks those individuals whose FVC is underestimated and FEV1/FVC ratio overestimated due to some degree of gas trapping. It also overlooks individuals that have positional airway obstruction that is not evident in the upright position.

We’ve fallen into the trap of thinking that there’s only one way to perform spirometry, and this is a mistake.

Continue reading

Turbine spirometers

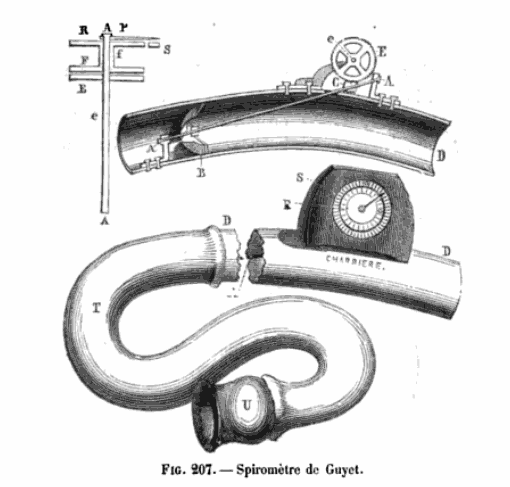
Turbine spirometers have been around in one form or another for well over a hundred years. The accuracy of the early versions of this type of spirometer was poor, partly because of the turbine designs weren’t terribly efficient and partly because these devices were mechanical in nature and the gear trains or other mechanical linkages added a lot of friction and resistance.

Spirometer_Guyet_1875

From: Nouveaux éléments de pathologie générale, de séméiologie et de diagnostic. by Eugène Bouchut, 1875, page 865. ]

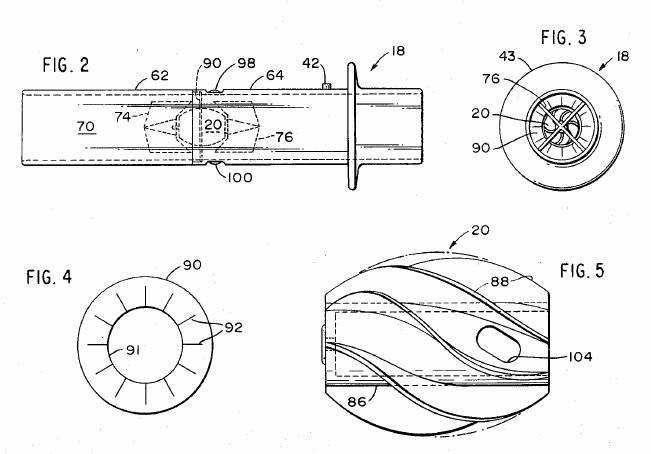
The first electronic turbine spirometer was the Marion Labs Spirostat which came to market in the early 1970’s. It used a disposable in-line turbine where the turbine blades were directly in the stream of inspiratory and expiratory flow and rotated accordingly. There was an optical pickup (a light beam passing through a hole in the turbine) and the rotations were converted to inspiratory and expiratory volumes. The passageways through the Spirostat’s turbine sensor were quite narrow and the resistance to flow was high. The turbine also had a fair amount of mass, was perceptibly slow to start moving and slow to stop and would not have met the current ATS/ERS standards.

Spirometer_Marion_Labs_Spirostat_Turbine_Sensor_1972

Spirostat sensor drawing from US patent number 3680378

Continue reading

Graphical Analysis of Flow-Volume Loops

I’ve been thinking a bit about the shape of flow-volume loops lately. In part this has been about ways to accurately describe them in reports; in part speculation about the information that may be embedded in them that isn’t in any of the routinely reported spirometry values; and in part about how the human eye perceives and categorizes them in a way that is difficult to simplify and put into a computer algorithm. A couple days ago I found a recent article where a geometrical analysis was applied to flow-volume loops in individuals with COPD and this got me curious about what other graphical techniques have been used to analyze flow-volume loops.

Given how long flow-volume loops have been around (over 50 years) the graphical analysis of flow-volume loops has been attempted remarkably few times. Excluding a handful of strictly numerical approaches (based primarily on MEF and MIF ratios) I was only able to find three graphical analysis techniques. I think this small number says volumes about the difficulty of analyzing flow-volume loop shapes meaningfully. Despite different degrees of sophistication the reality is that none of these techniques has ever seen any kind of common usage. Even so these attempts are both interesting and instructive.

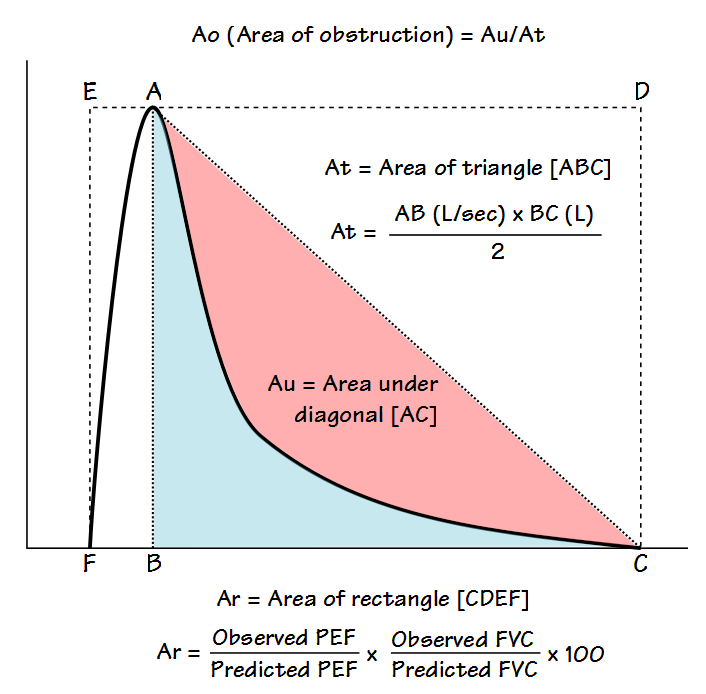
The most recent technique is a fairly straightforward geometric approach from Lee et al and its use appears to be limited primarily to individuals with airway obstruction.

FVL_Geometric_1

The flow-volume loop is analyzed primarily to determine what the authors call the Area of Obstruction (Ao). To do this, a diagonal line is drawn from peak flow to the end of exhalation. The area that exists between the actual flow-volume loop contour and this diagonal line is defined as the area under the diagonal (Au). The area of Au is then compared to the area of a triangle (At) defined by the peak flow, the exhaled volume at the time of the peak flow, and the end of exhalation. The area of obstruction, which is actually a ratio, is then calculated as:

Continue reading

The importance of an earnest SVC

A report came across my desk today and at first glance it looked fairly straightforward. There was a mildly reduced TLC and FVC, and although the SVC was slightly lower than the FVC it looked like this patient had mild restriction.

Observed: %Predicted: Predicted:
FVC: 1.73 68% 2.56
FEV1: 1.23 65% 1.89
FEV1/FVC: 71 97% 73
TLC: 3.58 73% 4.89
FRC: 2.07 75% 2.78
RV: 1.94 83% 2.33
RV/TLC: 54 114% 48
SVC: 1.69 66% 2.56
IC: 1.51 72% 2.11
ERV: 0.13 30% 0.45

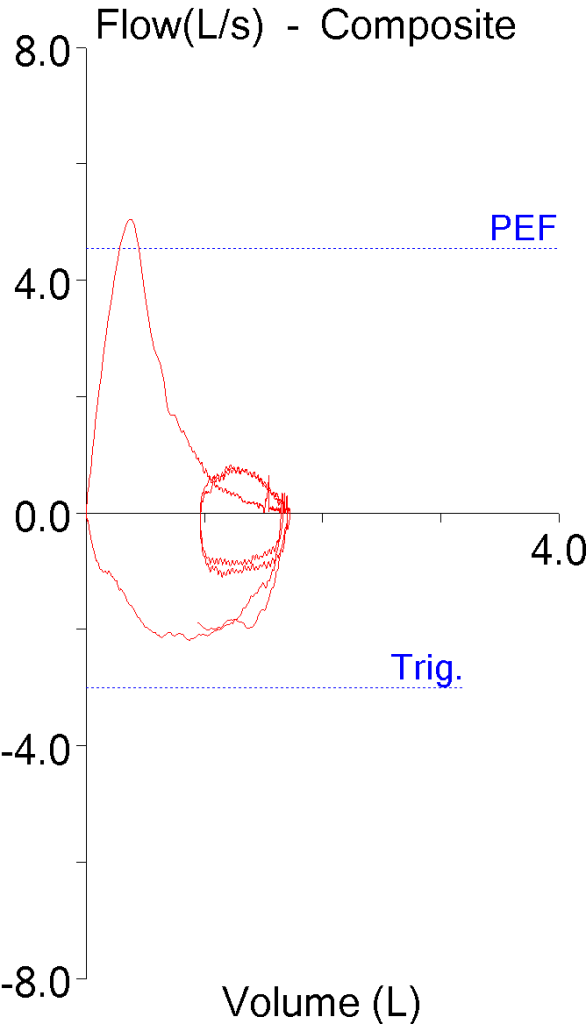
In addition, the flow-volume loop looked fairly typical for restriction, with a normal peak flow and a reduced volume.

SVC_TLC_Under_FVL_redacted

When I looked at the DLCO results however, I suddenly got a different picture. Specifically, the VA from the DLCO was larger than the TLC and the inspired volume (Vinsp) was significantly larger than both the FVC and the SVC.

Observed: %Predicted: Predicted:
DLCO: 13.51 83% 16.23
VA: 3.87 82% 4.73
Vinsp: 2.26

Continue reading