RVD’s and OVD’s can’t mix without the FEV1/FVC ratio

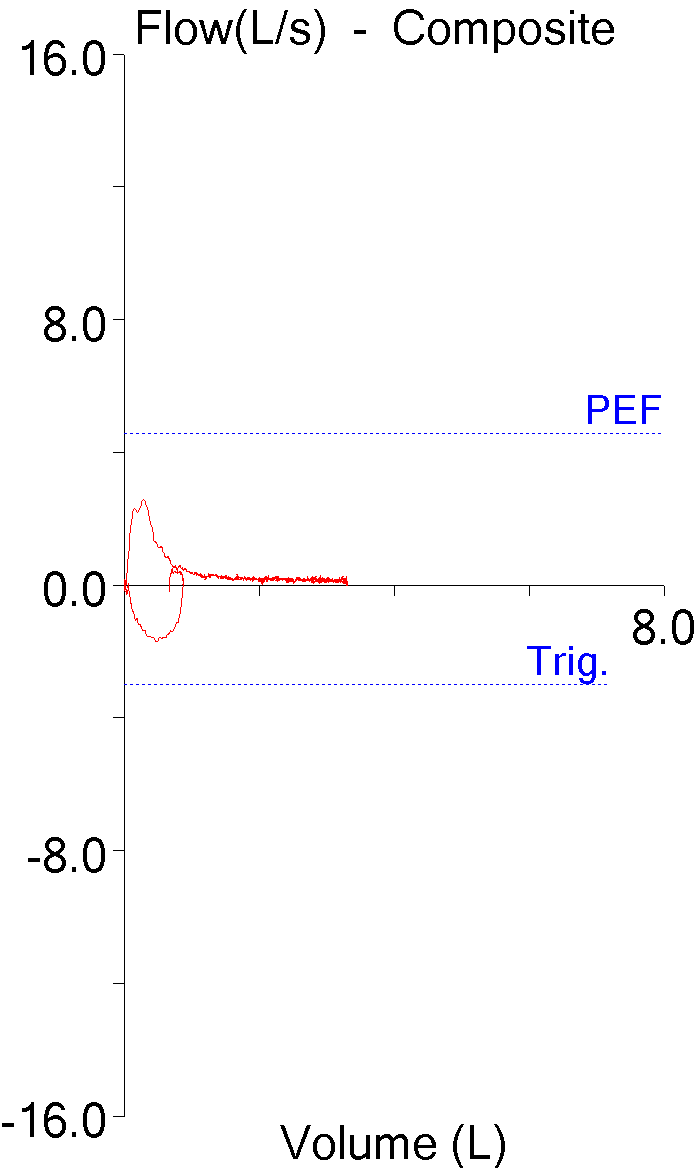
The patients whose reports I review have always been very accommodating. An issue of one kind or another catches my attention and before I know it I find several more reports that are similarly involved. Thanks to our patients I’ve had a number of reports come across my desk recently that showed a combination of restrictive and obstructive defects. This particular one may not be the best possible example but it seems to illustrate several points fairly well.

Observed: %Predicted: Predicted:
FVC (L): 1.12 40% 2.80
FEV1 (L): 0.75 35% 2.16
FEV1/FVC (%): 67 86% 78
TLC (L): 1.92 42% 4.54
FRC (L): 1.18 48% 2.47
RV (L): 0.76 44% 1.73
RV/TLC (%): 40 104% 38

Interpreting results like this as combined (or mixed) defects using the ATS/ERS algorithm seems relatively straightforward.

ATS-ERS Algorithm 2

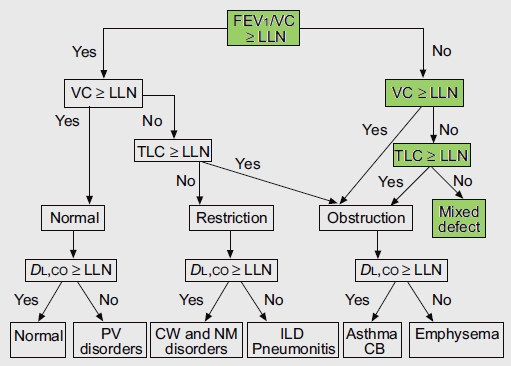
From Brusasco V, Crapo R, Viegi G. ATS/ERS Task Force: Standardisation of pulmonary function testing. Interpretive strategies for lung function tests. Eur Respir J 2005; 26, page 956

The algorithm starts by using the FEV1/FVC ratio to determine whether obstruction is present and only then considers whether or not the FVC and TLC are normal. It occurred to me however, that this assumes that the normal range of the FEV1/FVC ratio is preserved when TLC decreases below normal. Given the markedly different causes of restrictive lung disease it would seem that saying that the FEV1/FVC ratio should remain within the normal range over a relatively broad range of lung capacities (and without necessarily knowing the cause for any reduction) seems a bit far-fetched. Interestingly enough however, it actually turns out to be reasonably true.

Continue reading

Hepatopulmonary syndrome

My hospital has an active liver transplantation program and all transplant candidates get a full panel of PFTs in my lab. The number of liver transplant candidates we get varies from week to week but probably averages between 150 and 200 a year. As with any population a certain number of them have COPD or other lung diseases but there are some that have normal spirometry and lung volumes but a reduced DLCO. This latter group of patients likely have hepatopulmonary syndrome (HPS).

There are three hallmarks of hepatopulmonary syndrome. First is the presence of a liver disease (most commonly cirrhosis and hepatitis although liver cancer can also be a cause). Second are intrapulmonary vascular dilations (usually determined by transthoracic contrast-enhanced echocardiography). The third are gas exchange abnormalities, which include hypoxia and a reduced DLCO. The more severe cases of HPS may also have some additional (and somewhat unusual) symptoms: platypnea (dyspnea induced by the upright position) and orthodeoxia (a decrease in PaO2 and SaO2 when changing from the supine to upright positions).

For reasons that aren’t completely clear liver disease can cause chronic vasodilation of the systemic and pulmonary vasculature. The normal diameter of the pulmonary capillaries is in the range of 8-15 microns. When dilated due to liver disease they can be as large as 100 or even 500 microns in diameter. This allows mixed-venous blood to pass through the pulmonary capillaries very quickly or even directly into the pulmonary veins, and this in turn causes arterial hypoxia.

HPS severity is usually graded according to the level of hypoxia. First, for HPS to be considered at all, an individual’s alveolar-arterial oxygen gradient (PAaO2) needs to be greater than 15 mm hg. After that HPS is graded using PaO2 (room air, sea level) as:

PaO2 (mm Hg)
Mild ≥80
Moderate <80, ≥60
Severe <60, ≥50
Very Severe <50

Interestingly CO2 retention is never seen in hepatopulmonary syndrome, and in fact since these individuals usually chronically hyperventilate, hypocapnia (PaCO2 < 35) and respiratory alkalosis are often present.
Continue reading

The clue was in the O2

One of the overlooked parts of teaching pulmonary function interpretation is developing an appreciation for the number and variety of errors that the equipment, patients and technicians can produce and how they affect the reported test results. I routinely run across a couple dozen errors each week while reviewing reports. Most are minor and do not significantly affect the reported results. Many are mundane because they appear so often and a few are interesting because they point out a particular limitation in the equipment, software or testing standards. I’ve kept a file of the more iconic examples of testing errors for years and a while ago a pulmonary staff physician and I used to hold weekly sessions for fellows and residents where we’d present a number of “zingers” to see if they could figure them out. Unfortunately that physician has moved on to a different institution and I’m no longer as available as I used to be so these sessions are no longer held but I think that they or something like them should be held in all teaching hospitals.

These spirometry results came from a middle-aged woman with sarcoidosis.

Observed: %Predicted: Predicted:
FVC: 3.55 155% 2.29
FEV1: 1.06 60% 1.77
FEV1/FVC Ratio: 30 39% 77

Elevated FVC’s are not all that uncommon (and are a good example of the limitations of reference equations), but one that is 155% of predicted is particularly unusual. This occurs most commonly when somebody has made an error in measuring or entering the patient’s height (I can’t tell you the number of times I’ve seem someone entering 60 inches when they meant 6 feet), but this patient has been seeing pulmonary physicians and having regular spirometry tests for over a decade and the height for this test was the same as it was for the previous visit. In addition the trend report showed that over the last year the patient’s FVC had been between 71% and 65% of predicted.

Transtracheal_O2_FVL

The flow-volume loop doesn’t look overly unusual although the expiratory flow doesn’t taper off to zero and the patient maintained a low expiratory flow for at least two-thirds of the vital capacity.
Continue reading

Goiter, upper airway obstruction and the flow-volume loop

The thyroid gland is located across the front of the upper airway a short distance below the larynx. An enlarged thyroid gland is known as a goiter. The most common worldwide cause of goiter is an iodine deficiency. This is much less common in the western nations where factors such as Hashimoto’s thyroiditis, Graves’ disease, multi-nodular thyroid disease, thyroid cancer, pregnancy and the side effects of some medications are the its primary causes. Common respiratory complaints associated with goiter include cough, hoarseness, shortness of breath and stridor.

thyroid-gland

[illustration from HealthyThyro.com]

When a goiter is large enough it can press against the trachea and cause a narrowing or deviation of the upper airway. My lab usually gets at least a couple of patients referred to us every year with a diagnosis of goiter and a request that we assess whether it is causing any significant airway obstruction. Decades ago I was taught by my medical director that when this occurs it shows up as an expiratory plateau on a flow-volume loop.

FVL_Expiratory_Plateau

The reality (as usual) is more complex and this is mostly because the thyroid gland lies close to the boundary between the extrathoracic and intrathoracic sections of the trachea. Depending on its size and the which direction the thyroid expands towards, goiter can show up as an extrathoracic or intrathoracic airway obstruction. Even more importantly, as a recent article in Chest showed, the airway obstruction from goiter can be dependent on body position as well.

Continue reading

The 8 Percent Solution

The current ATS/ERS standards for a positive bronchodilator response are an increase in FEV1 or FVC of ≥ 12% and ≥ 200 ml. These standards are largely based on the ability to detect a change that is far enough above the normal variability in FEV1 and FVC to be considered significant. One problem with this is that the amount of variability that is considered to be “normal” is overly influenced by a relatively small number of subjects that have a high degree of variability.

At least one group of investigators has suggested that a way around this is to subject all of an individual’s pre- and post-bronchodilator spirometry to statistical analysis in order to determine their coefficient of variability. Once this is known, the pre- and post-bronchodilator efforts can be assessed as a group to determine whether whether there has been a statistically significant change. Using this approach they were able to show that a rather large number of subjects that did not meet the ATS/ERS criteria did have a statistically significant improvement in FEV1.

But an increase that is statistically significant or one that is greater than normal variability is not the same thing as clinical significance. Numerous investigators have noted that patient can have a post-bronchodilator clinical improvement as shown by a decrease in dyspnea or an increase in exercise capacity without any notable change in FEV1 or FVC. Clinical significance is hard to measure however, particularly since which criteria should be used to measure it are unclear.

Long-term survival is certainly clinically significant and a recent article in Chest (Ward et al) has linked the increase in post-bronchodilator FEV1 to this fact. What these investigators have been able to show was that individuals with a post-bronchodilator increase in FEV1 that was 8% of predicted or greater showed a significantly better long-term survival than individuals with a smaller increase.

Continue reading