What’s normal about MIP and MEP?

The static respiratory pressures, Maximal Inspiratory Pressure (MIP or PIMAX) and Maximal Expiratory Pressure (MEP or PEMAX) are a way to non-invasively assess respiratory muscle strength. Respiratory muscle weakness is present in a number of conditions, most notably neuromuscular diseases and disorders, but also malnutrition, cardiovascular disease, polymyositis, sarcoid and COPD. Strictly speaking, the maximal inspiratory and expiratory pressures are not generated solely by the respiratory muscles but also by the elastic recoil. The elastic recoil of the lung at TLC contributes up to 40 cm H2O towards MEP and the elastic recoil of the chest wall at RV contributes up to 30 cm H2O towards MIP. Even so, an individual cannot reach TLC or RV without the use of their respiratory muscles so the measurements are still valid regardless of how the pressures are generated.

I have mixed feeling about MIPs and MEPs but this is mostly because many patients perform these tests poorly, making it hard to interpret results. Normal results can rule out respiratory muscle weakness but reduced results are not necessarily diagnostic. Nevertheless, they are still valuable tests and it is important for them to be performed correctly.

MIP is measured at RV and MEP is measured at TLC. The ATS/ERS statement on respiratory muscle testing indicates that each effort should last at least 1.5 seconds and that at least three measurements within 20% of the highest value should be obtained. A maximum number of attempts has not been specified but most research studies limited this to 5 or 6.

The actual maneuver depends somewhat on the equipment configuration. Respiratory pressures were originally measured using a pressure gauge and most early systems consisted of just a mouthpiece and a gauge (or gauges).

from 'Interpretation of Pulmonary Function Tests - A Practical Guide' by RE Hyatt, PD Scanlon and M Nakamura, Published by Lipincott-Raven, 1997, page 90.

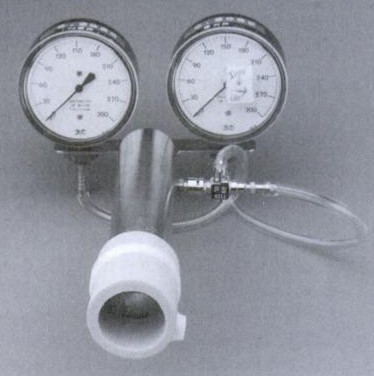
from ‘Interpretation of Pulmonary Function Tests – A Practical Guide’ by RE Hyatt, PD Scanlon and M Nakamura, Published by Lipincott-Raven, 1997, page 90.

To use this type of system the patient either exhales to RV or inhales to TLC, places their lips around the mouthpiece and then forcefully inhales or exhales. Because of the limited amount of time available for lip placement a round plastic or cardboard mouthpiece is usually used.

Continue reading

The VA/TLC ratio

I was reading James Hansen’s textbook on pulmonary function testing (one of my more interesting reads lately) and in passing he mentioned using the VA/TLC ratio as a way to measure ventilation inhomogeneity. The VA/TLC ratio has also been called the Va,eff/VA ratio and the VA’/VA ratio by different researchers but regardless of what it is called it is the ratio between a single-breath TLC measurement (VA) taken from a DLCO test and a multi-breath (helium dilution or N2 washout) or plethysmographic TLC.

A single-breath TLC regardless of whether helium, nitrogen, methane or argon is used tends to underestimate TLC even in individuals with normal lungs (and if the ratio > 1.0 then there is likely a technical problem with either the lung volume or DLCO measurements). This is mostly because of the limited time a single breath of tracer gas has to mix and diffuse evenly throughout the lungs. The idea is that a low VA/TLC ratio indicates poor gas mixing and therefore an elevated ventilation inhomogeneity.

The VA/TLC ratio is a relatively simple approach towards measuring ventilation inhomogeneity largely because the results can be derived from regular TLC and DLCO measurements. It was first proposed as a measurement over 40 years ago but despite having several notable proponents it has not achieved any particular level of acceptance.

Part of the reason for this may be that there is limited agreement about what a constitutes a normal VA/TLC ratio. Cotes et al suggest that the ratio decreases slightly with age and stated that the normal range is 0.9 to 1.0 at age 20 and 0.85 to 0.95 at age 60. Roberts et al, however, in a study with a reasonably large population (n=379) selected for the presence or absence of certain conditions (normal, asthma, COPD) found no particular correlation with age (or height, weight and gender) and stated that in individuals with normal FEV1/FVC ratios the LLN was 0.828. Punjabi et al in a retrospective study of 5369 individuals unselected except for the presence of acceptable test quality stated that for FEV1/FVC ratios above 0.70 the VA/TLC ratio was 0.98.

There is general agreement however, that the strongest correlation between TLC and VA is an individual’s FEV1/FVC ratio.

VA/TLC ratios from Burns et al.

The correlation between VA/TLC ratio and the FEV1/FVC ratio from Burns et al.

VA_TLC_Ratio_Formula_Burns

Continue reading

Vocal cord dysfunction

Recently I reviewed a set of completely irreproducible spirometry results. The patient had made eight attempts and the FVC, FEV1 and Peak Flow were different every time. In particular, there were frequent stops and starts during exhalation. I’ve always wondered why some patients have so much difficulty with what should be a simple test and although in this particular case it could simply be glottal closure I wondered if it could be Vocal Cord Dysfunction (VCD). For this reason I spent some time reviewing the literature.

Vocal Cord Dysfunction is defined as the paradoxical closure of the vocal cords with variable airflow obstruction that often mimics asthma and in fact VCD is often mistaken for refractory asthma. Unfortunately, for this reason individuals with VCD are often treated with corticosteroids and bronchodilators for years without any improvement of their symptoms.

The gold standard for diagnosing VCD is direct visualization of the vocal cords with a laryngoscope. Characteristically, the anterior (frontal) two-thirds of the vocal cords are closed with a narrow posterior glottal chink. The difficulty with this is that VCD symptoms are often transitory and a large number of patients that are suspected to have VCD are asymptomatic when a laryngoscopy is performed.

Since most PFT labs are not equipped with laryngoscopes nor are they prepared to perform a laryngoscopy at a moment’s notice we have to rely on the tests that measure airflow. Although the wheeze and shortness of breath that accompanies VCD mimics asthma the most common problem associated with VCD is inspiratory obstruction. The flow-volume loop pattern is therefore that of a variable extrathoracic airway obstruction.

VCD_FVL

Continue reading

Tidal flow-volume loops

I was reviewing a spirometry report and noticed something odd about the flow-volume loop, or more specifically the tidal loop, and this got me to thinking about what tidal loops can tell us about test quality, patient physiology and the ability of the technician to coach a spirometry test.

FVC_with_no_IC_Redacted2

There are at least a couple things wrong with this FVC test effort. First the exhalation time was only about 3 seconds so the FVC volume was likely underestimated by a fair amount. Second, it wasn’t reproducible and this was actually the patient’s the best test effort. What I noticed however, was that the tidal loop was shifted almost completely to the left.

There are a number of criteria for assessing the quality of a forced vital capacity. Exhalation quality can be determined reasonably well by back extrapolation, expiratory time and the terminal expiratory flow rate. When it comes to assessing the completeness of the inspiration that precedes the exhalation however, there really isn’t much to go on other than the reproducibility of an individual’s spirometry efforts.

When I measured the tidal loop what I saw was that IRV was about 0.10 L and the ERV, although likely underestimated by a fair amount, was at least 0.80 L. What I actually think this tidal loop is saying is that the patient didn’t take as deep a breath as they could at the start of the test, but what other things could affect the position of the tidal loop?

Continue reading