Washout volume, transit time and DLCO

Recently while reviewing PFT reports I ran across a test from a patient who had been having spirometry, lung volume and DLCO tests performed at regular intervals for the last several years. Compared to the last several set of tests the most recent DLCO had decreased significantly while the FVC, FEV1 and TLC hadn’t changed. I took a closer look at the raw data from the DLCO test and when I did I saw that the washout volume was not correct.

Alveolar_Sample_Unadjusted_Cropped

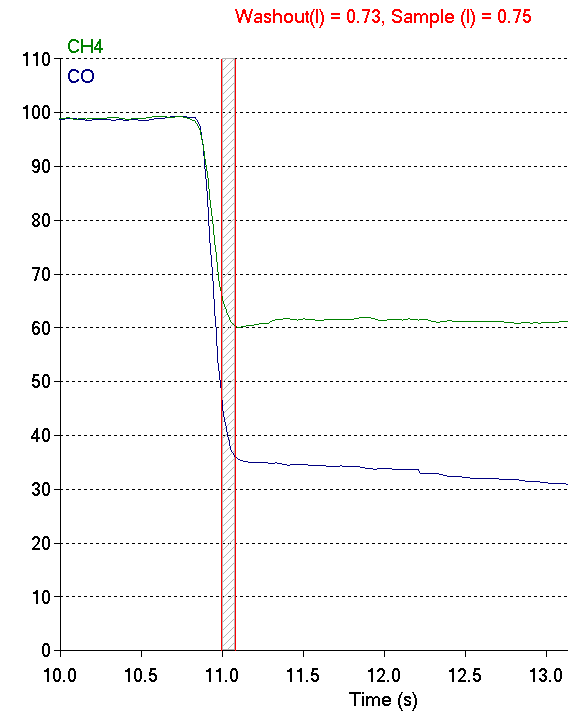
Or more correctly, even though the washout volume matched the ATS/ERS standard for DLCO testing it was evident the expiratory gas sample was not taken from the alveolar plateau. The CO and CH4 concentrations at this point in the exhalation are higher than they are in the alveolar plateau and this means the reported DLCO was underestimated.

Alveolar_Sample_Adjusted_Cropped

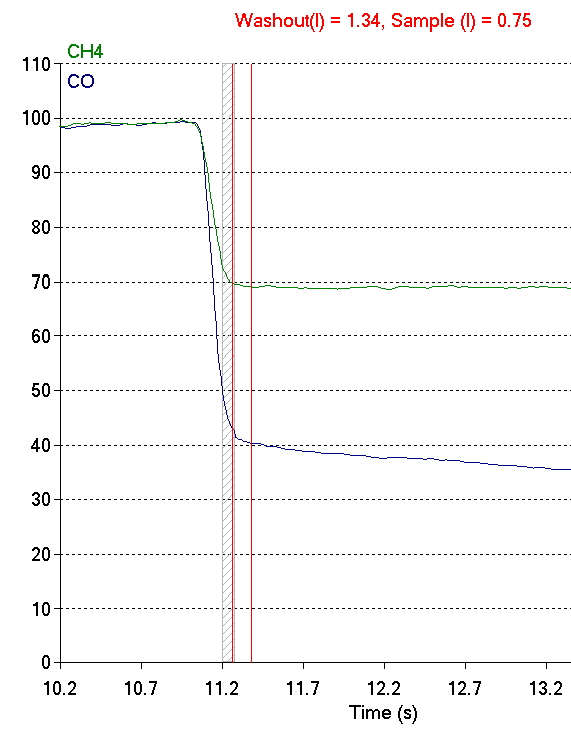
When I re-adjusted the washout so the gas sample was taken from the alveolar plateau, the DLCO went from 18.56 ml/min/mmHg to 22.26 ml/min/mmHg, which is a 20% increase and far more in line with the patient’s prior DLCO test results.

This, however, increased the washout volume from 0.75 L to 1.34 L. Why was the washout volume so high? The answer is it probably wasn’t.

Continue reading

Diagnosing Mitochondrial Myopathies

I’ve been reviewing my CPET textbooks trying to get a better idea of how to differentiate between different cardiovascular limitations. The other day I ran across an article on a related subject and thought it might be instructive.

The hallmark of cardiovascular limitations is the inability to deliver enough oxygenated blood to the exercising muscles. Another limitation that has similarities to this (and one that is infrequently diagnosed) is the inability of the exercising muscle to utilize the oxygen delivered to it. The best examples of this type of exercise limitation are mitochondrial myopathies (MM).

The mitochondria are the primary source of the ATP used by exercising muscle. There are several conditions that can cause the number of mitochondria to be reduced and there is wide variety of mitochondrial genetic defects. Mitochondria have their own genes and these can have both inherited or acquired genetic defects which can cause anything from mild to severe decreases in the ability to produce ATP. Mitochondria require oxygen to produce ATP so when the number of mitochondria are reduced or their ability to produce ATP is reduced the rate at which oxygen is consumed by an exercising muscle is also reduced.

A relatively common complaint of individuals with MM is dyspnea and exercise intolerance. One study found that 8.5% of all the patients referred to a dyspnea clinic had a mitochondrial myopathy of one kind or another. A definitive diagnosis requires a muscle biopsy but because the symptoms are often non-specific and a biopsy is an invasive procedure, it is usually not performed unless there more significant evidence suggesting a MM.

Continue reading

The effects of Obesity on lung function

Obesity has become far more commonplace than it was a generation ago. The reasons for this are unclear and have been attributed at one time or another to hormone-mimicking chemicals in our environment, altered gut biomes, sedentary lifestyles or the easy availability of high calorie foods. Whatever the cause, obesity affects lung function through a variety of mechanisms although not always in a predictable manner.

Spirometry:

Many investigators have shown a relatively linear relationship between an increase in BMI and decreases in FVC and FEV1. These decreases are small however, and FVC and FEV1 tend to remain within normal limits even in extreme obesity. The decreases in FEV1 and FVC tend to be symmetrical which is shown by the fact that the FEV1/FVC ratio is usually preserved in obese subjects without lung disease. Several studies have shown that the decreases in FVC and FEV1 are reversible since a decrease in weight showed a corresponding increase in FVC and FEV1.

In one study a 1 kg increase in weight correlated with a decrease in FEV1 of approximately 13 ml in males and 5 ml in females. The same increase in weight correlated with a decrease in FVC of approximately 21 ml in males and 6.5 ml in females. The greater change in FVC and FEV1 in males than females has been attributed to the fact that males tend to accumulate extra weight primarily in the abdomen.

The notion that abdominal weight has a disproportionate effect on lung function is seconded to some extent by studies that have shown that decreases in FVC and FEV1 correlated better with increases in waist circumference and the waist to hip ratio than with BMI. One study showed a 1 cm increase in waist circumference caused a 13 ml reduction in FVC and an 11 ml reduction in FEV1 across a range of elevated BMI’s.

Continue reading

When TLC, RV and VC don’t add up

I thought I was done with lung volume issues for at least a little while but a short time ago I was reviewing a report from another PFT lab and I ran across something that didn’t seem to make sense. What the report showed was a normal TLC (99% of predicted) with a normal VC (101% of predicted) but the RV was 70% of predicted.

When I took a closer look, it was evident that the predicted VC came from the NHANESIII study and the predicted TLC and RV came from the ERS 1993 Statement. In my PFT lab our equipment manufacturer made the decision to use the predicted RV from whatever source the end-user selected (which in our case is the ERS93 study as well) but to re-calculate the predicted TLC using the predicted FVC, again from whatever source the end-user selected (which in our case was also NHANESIII). What this means is that for my lab:

predicted TLC = predicted VC + predicted RV.

What I saw in the report however, was that the predicted TLC and RV came from the ERS93 study and the predicted VC came from NHANESIII but that meant that:

predicted TLC ≠ predicted VC + predicted RV.

In fact the predicted TLC was almost a half a liter less than if it had been calculated from the predicted RV and predicted VC. What I also saw was that:

predicted TLC ≠ predicted FRC + predicted IC

predicted RV ≠ predicted FRC – predicted ERV

Continue reading