The NHANESIII FEV1/FVC ratio and height, revisited

I was reading James Hansen’s textbook on pulmonary function testing and ran across a spot where he made a minor criticism of the NHANESIII (Hankinson et al) reference equations for the FEV1/FVC ratio. Specifically he noted that the NHANESIII equation ignored height and only used age as a variable but that when he compared the directly calculated FEV1/FVC ratio with one indirectly derived from predicted FEV1 and FVC there was a discrepancy across the normal ranges of height of up to 2.4%.

I had also noticed this discrepancy and wrote about it a while back but at the time I’d only been discussing my lab’s adoption of the NHANESIII reference equations. Hansen’s observation intrigued me, so I decided to re-visit this issue more systematically.

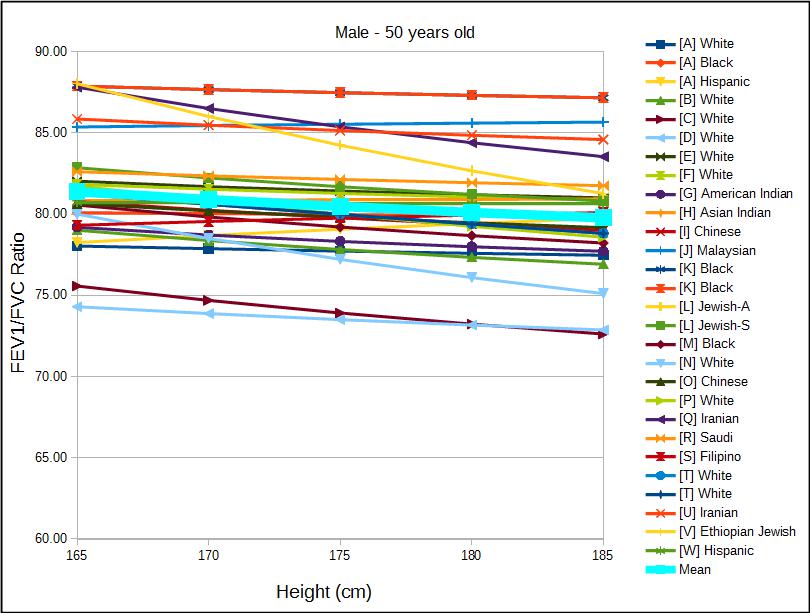
To do this I’ve taken 23 different reference equations for men and women and a variety of ethnicities and plotted the change in the FEV1/FVC ratio versus height, and then repeated this across a range of ages.

Male_50yo

Continue reading

The CPET’s not over until it’s over

My guidelines for interpreting CPETs originally started as notes to myself about what needed to be on the report and what the normal values were. They grew into a more formal set of instructions that were given to the pulmonary fellows when they were reviewing CPETs. Lately I’ve been reviewing them and re-reading the source material in order to make sure what I had written was still correct and so I could add references.

I tend to focus on one aspect of testing at a time and noticed while reviewing material that the measurements made at peak exercise or anaerobic threshold are almost always considered to be the most important test values. This is true to an extent, but information gathered both before and after testing is also important. In particular, after exercise has ended, during the recovery period, there are several measurements that should be made routinely and are diagnostically significant.

Heart rate recovery (HRR)

When exercise ends, an individual’s heart rate should start decreasing from its peak value. The heart rate recovery (HRR) is the difference between the heart rate at peak exercise and at some interval, usually 1 minute, post-exercise. The rise in heart rate during exercise is due to a combination of parasympathetic withdrawal and sympathetic activation. Vagal reactivation is the principle determinant of heart rate recovery after exercise and a reduction in the heart rate recovery (HRR) indicates a decrease in vagal tone specifically, and parasympathetic tone generally.

Continue reading

There’s more than one way to determine AT

As workload increases during a progressive cardiopulmonary exercise test (CPET) there comes a point at which the amount of oxygen delivered to the exercising muscle is no longer able to meet its needs. This is the point at which lactic acid begins to accumulate, CO2 production increases and is the accepted definition of the Anaerobic Threshold (AT). The “gold” standard for determining AT is lactic acid measurements but these require sampling blood at regular intervals throughout the CPET. AT is far more commonly determined from respiratory parameters.

Recently I had the opportunity to observe a CPET performed at another PFT Lab. Following the CPET I saw that there was some difficulty in determining the AT. Part of the reason for this is that the staff had only been shown the V-slope method and weren’t aware that there are several alternative approaches.

The V-slope method graphs VCO2 versus VO2. The slope of relationship between VCO2 and VO2 both above and below AT is relatively linear, but changes at AT.

V-slope

Continue reading

Substituting an FVC for an SVC in Lung Volume measurements

Recently I was reviewing test results from another PFT Lab that uses equipment from a different manufacturer than what my lab uses. When I came to the lung volumes it became evident that the FVC had been substituted for the SVC. I understand the point of using the largest vital capacity when calculating TLC and RV but there are some issues affecting these values when this is done.

Strictly speaking using the FVC is permitted by the ATS/ERS guidelines on lung volume testing, but how an FVC is to be used, as opposed to an SVC, is not addressed. The reason this is an issue is that all lung volume tests regardless of which method is used do not measure TLC and RV directly, they measure FRC. The preferred ATS/ERS TLC calculation is then:

RV = FRC – ERV and TLC = RV + VC

But

TLC = FRC + IC and RV = TLC – VC

is also permitted.

IC and ERV are not explicitly measured from an FVC maneuver and are instead measured during an SVC measurement.

FRC IC ERV VC

Continue reading

When is it hyperinflation?

I was reviewing a PFT recently and noticed that the FEV1 was severely reduced and that the FRC and RV were both elevated. This is a pattern we associate with obstructive gas trapping but I’ve also been reviewing textbooks on pulmonary function interpretation and have found that there isn’t any kind of a universal definition for this.

Hyperinflation and gas trapping are used somewhat interchangeably but the distinction is that gas trapping causes hyperinflation. Gas trapping occurs to some extent in everybody but usually at lung volumes below FRC. The lung volume at which gas trapping occurs rises with age and with obstructive lung disease. Hyperinflation is usually considered to be an increase in FRC but FRC is a dynamic lung volume and there is a range in the response to increased gas trapping. The normal progression from mild to very severe COPD goes something like this:

FEV1: FVC: FRC: RV: TLC: RV/TLC:
Mild
Moderate ↓↓
Severe ↓↓↓ ↓↓ ↑↑ ↑↑
Very Severe ↓↓↓↓ ↓↓↓ ↑↑ ↑↑↑ ↑↑↑

Gas trapping and hyperinflation have significant consequences for an individual’s exercise capacity and level of dyspnea. It is an important clinical finding but from a PFT point of view when is it clearly present?

Continue reading