What’s up with Peak Flow?

Two PFT reports came across my desk recently and comparing them got me to thinking about Peak Expiratory Flow (PEF). The FEV1 from both tests were mildly reduced with an FEV1/FVC ratio that was moderately reduced and an FVC that was within normal limits.

Peak_Flow_1

Observed: %Predicted:
FVC (L): 3.72 96%
FEV1 (L) 2.17 78%
FEV1/FVC (%): 58 80%
PEF (L/sec): 2.97 41%

Peak_Flow_2

Observed: %Predicted:
FVC (L): 2.46 88%
FEV1 (L) 1.66 75%
FEV1/FVC (%): 67 83%
PEF (L/sec): 7.65 128%

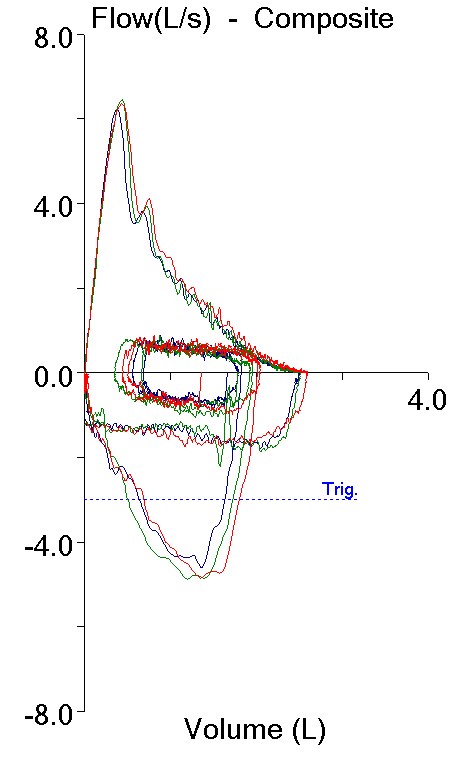
Both tests also showed mild airway obstruction but despite this the Peak Flows were quite different. One test had a PEF that was moderately to severely reduced and the other had a PEF that was elevated. It’s fascinating that two such completely different flow-volume loops are so numerically similar.

In another sense, though, how can these two different spirometry efforts both be labeled as mild airway obstruction? Or more importantly, they both may be mild obstruction but isn’t the quality of the obstruction different?

Continue reading

What’s a normal post-pneumonectomy CPET?

Recently a CPET report for an individual whose primary complaint was tachycardia and DOE with minimal activity came across my desk. Since the patient had had an pneumonectomy (one lung removed) about a year ago there wasn’t much doubt the results would be reduced, the question was whether they were reduced more than they should have been.

You might expect lung function to decrease by half following a pneumonectomy but because the remaining lung always expands to some extent FVC and TLC tend to be approximately 60%-65% of their pre-surgical volume. Although this increase in volume however does not increase the alveolar-capillary surface area the entire cardiac output needs to pass through the remaining lung which causes an increase in the pulmonary capillary blood volume. For this reason DLCO also tends to be about 65% of baseline.

Observed: %Predicted:
FVC (L): 2.08 62%
FEV1 (L): 1.62 57%
FEV1/FVC (%): 79 92%
TLC (L): 2.89 64%
DLCO (ml/min/mmHg): 11.55 54%

With the exception of the DLCO the patient’s pulmonary function results were about what would be expected following a pneumonectomy. It’s hard to be sure the DLCO is anomalously low because the surgery was performed at a different hospital and we don’t have any pre-surgical pulmonary function results to compare them to. Since this is also the first time the patient had a CPET there isn’t anything to compare the current results to either.

Continue reading

What does it mean when Ve exceeds its predicted during a CPET?

When I review the results from a CPET I am used to considering a maximum minute ventilation (Ve) greater than 85% of predicted as an indication of a pulmonary mechanical limitation. Recently a CPET report came across my desk with a maximum minute ventilation that was 142% of predicted. How is this possible and does it indicate a pulmonary mechanical limitation or not?

It is unusual to see a Ve that is greater than 100% of predicted. We derive our predicted max Ve from baseline spirometry and calculate it using FEV1 x 40. We have tried performing pre-exercise MVV tests in the past and using the maximum observed MVV as the predicted maximum Ve but our experience with this has been poor. Patients often have difficulty performing the MVV test correctly and realistically even if it is performed well the breathing maneuver used during an MVV test is not the same as what occurs during exercise. Since both Wasserman and the ATS/ACCP statement on cardiopulmonary exercise testing recommend the use of FEV1 x 35 or FEV1 x 40 as the predicted maximum minute ventilation we no longer use the MVV.

There are usually only two situations where a patient’s exercise Ve is greater than their predicted max Ve. First, when a patient is severely obstructed their FEV1 is quite low and FEV1 x 40 may underestimate what they are capable of since they are occasionally able to reach a Ve a couple of liters per minute higher than we expected. Second, if the FEV1 is underestimated due to poor test quality then the predicted max Ve will also be underestimated. In this case however, the baseline spirometry had good quality, was repeatable and the results did not show severe obstruction but instead looked more like mild restriction.

Pre_Exercise_FVLs

Effort 1: Effort 2: Effort 3:
FVC (L): 2.51 2.52 2.60
FEV1 (L): 1.86 1.87 1.95
FEV1/FVC %: 74 74 75
PEF: 6.26 6.46 6.37

Continue reading