Looking at the past, looking to the future

As New Year’s Day approaches it is a tradition for people look back to see what has happened during the last year and then look forward and guess what will happen during the next year. I’ve never done a New Year’s blog before but I’ve been mulling over a number of ideas for a while and this looks like a good place to explore them.

I’ve had the opportunity over the last several years to research the history of pulmonary function testing. There are a couple of interesting lessons from the past that may be useful, particularly when we are trying to guess what direction pulmonary function testing is heading towards in the future.

The spirometer as we know it and the measurement of the Vital Capacity began with John Hutchinson in 1846. In a sense there was really nothing new in what he did. His spirometer was a modified gasometer that had been invented by James Watt in 1790 and used by other researchers (notably Humphrey Davy who was the first person to measure the Residual Volume). The Vital Capacity had also been measured previously by many individuals. The remarkable thing that Hutchinson did however, was to present the first true population study and to clearly show the relationship between age, height and the Vital Capacity.

Measuring the Vital Capacity took off like a rocket and researchers all across Europe and the United States studied it in many different diseases and locations. An incredibly wide variety of spirometer technologies were developed as well, some of which are still in use. Over and over again researchers tried to show the value of the Vital Capacity (particularly in Tuberculosis) but the reality is that the clinical value of the Vital Capacity is quite limited. This is because when you only look at the volume of the Vital Capacity there are many reason why it can be reduced and so the finding of a reduced Vital Capacity is non-specific. The clinical use of spirometers languished for decades and the biggest use of spirometers wasn’t clinical at all, they were instead mostly used in schools, gymnasiums and penny arcades to measure lung “power”.

Continue reading

Where are your emergency plans?

Around 20 years ago I had to write the emergency evacuation plan for the pulmonary function lab. Like many other administrative duties I learned that I needed to do this when my new administrator asked where it was and whether I had documented that I had reviewed it with the lab staff. Since I didn’t even have a real procedure manual at the time (just reprints of pertinent articles and textbook chapters) I ended up getting a crash course in writing policies. Fortunately the manager of a nearby departments let me borrow their evacuation plan and I was able quickly to knock one out that met the requirements fairly quickly. Since then I’ve had to review it annually and update it every time the lab moved or when rooms were added or taken away.

Yesterday I was reading the recently published ERS/ATS technical standards for field walking tests (and if you perform 6-minute walk or incremental shuttle tests then you will probably need to read it and update your procedures). One important change has been that because a 6-minute walk test can evoke a VO2 and heart rate response similar to CPETs the same absolute and relative contraindications now apply. For the same reason in the table of equipment required for walking tests along with the stopwatch and pulse oximeter the ERS/ATS standard now includes “An emergency plan”.

Continue reading

Multi-breath Washout and the Lung Clearance Index

The March 1, 2014 issue of the American Journal of Respiratory and Critical Care Medicine had an article on the use of the Lung Clearance Index (LCI) with bronchiectasis. The study showed that the LCI was as good as high-resolution computed tomography and more sensitive than FEV1 when assessing changes in airway status. This is one of the few articles I’ve seen on the LCI that was specifically about adults and wasn’t about cystic fibrosis.

So what is the LCI and how is it measured?

When lung tissue and airways are normal, inhaled gas is distributed evenly throughout the lung and the mixing and turnover of alveolar gas is relatively rapid. When airway obstruction is present gas distribution tends to becomes more uneven and the mixing and turnover takes longer. The Lung Clearance Index (LCI) is a way to measure these ventilation inhomogeneities and is basically a description of how much ventilation is required to completely clear the FRC. It was first described by Margaret Becklake in 1952 but has languished for many years. It has been revived in the last decade or so, particularly because it requires only tidal breathing which allows it to be measured in infants and children.

The measurement process is called an Inert Gas Multi-Breath Washout. It uses an open circuit and requires a tracer gas that is both inert and relatively insoluble and for these reasons has been primarily limited to helium, nitrogen and sulfur hexafluoride (SF6) although methane and argon could potentially be used as well.

Continue reading

Closing Volume

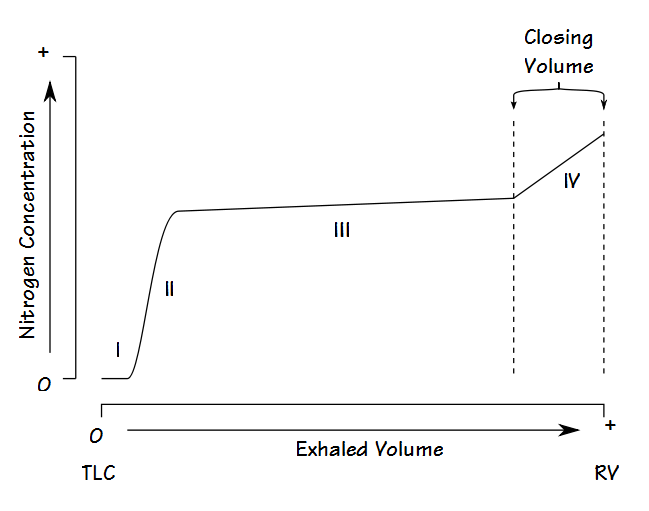
Closing Volume (CV) is a measurement made from a single-breath nitrogen washout (SBNW) test. It was commonly performed decades ago and elevated values were considered to be an indication of small airways disease and an aid in the detection of the early stages of airways disease. It is hardly ever performed any more but I still occasionally see research studies that include this test and almost every test system that is capable of measuring lung volumes by nitrogen washout is also capable of performing a CV.

The CV test is performed with a test system with an analyzer tap immediately next to the mouthpiece and a way of delivering 100% oxygen either from a demand valve or a reservoir. Originally this test was performed using a real-time nitrogen analyzer but it is now almost always performed with an oxygen analyzer instead. A subject is placed on the mouthpiece and exhales to RV and then inhales 100% oxygen to TLC. The subject then exhales steadily to RV and during the exhalation the subject’s exhaled nitrogen (either real or calculated from the oxygen concentration) is plotted against their exhaled volume and produces a curve that looks like this:

Closing Volume Graph

The trace is divided into four portions. Phase I is the very beginning of exhalation where only oxygen is being exhaled and consists primarily of test system and airway deadspace. Phase II is where the nitrogen concentration rises rapidly and consists of mixture of airway and alveolar gas. Phase III is where the nitrogen concentration plateaus and its slope depends on the uniform distribution of gas in the lung. Phase IV is where the nitrogen concentration rises more or less abruptly from the plateau and is considered to be part of the closing volume. The inflection point between phase III and phase IV is not always easy to discern and may need to be extrapolated from the phase III and phase IV slopes.

Continue reading

Standing height, ethnicity and the vital capacity

In 1844 John Hutchinson published his first paper describing his spirometer and his research on the Vital Capacity. He was the first person to use the word “spirometer” to describe his instrument and the first to use the term “vital capacity” to designate the maximum amount of air an individual can exhale after a maximal inhalation. Although he is remembered as the inventor of the spirometer, he was not the first person to use a gasometer to measure lung volumes nor was he the first to measure the vital capacity. What made his research different from those that came before him was partly the prodigious number of individuals whose vital capacity he measured but far more importantly that he was able to show a clear relationship between standing height, age and vital capacity which had not been previously apparent. This finding galvanized researchers in England, Europe and the United States and in many ways helped set the course of research into lung function for many decades to come.

This clear relationship between standing height and vital capacity has been taken as scientific fact since that time despite inconsistencies not only in Hutchinson’s data but in almost all population studies since that time. The problem is that the relationship between standing height and vital capacity is not precise but only approximate. In order to explain the range of results that appeared in his data Hutchinson and other researchers of his time divided their study population into groups by their occupation. This approach may appear to be quaint to us now but at the time they were very serious both about the utility of doing this and what it told them about the different classes of society.

The first studies on vital capacity that divided the population by race were done in the United States. The reasons that this was done are both simple and complex, and overall there’s not a lot we can look back and be proud of. At that time there was an overwhelming societal concern with the races in general and not only the recently freed black slaves and the Amerindians but also about the different “races” of Europe that were emigrating to the United States. There was much public talk and private thought about the concepts of racial degeneracy, racial mongrelization and racial vitality, and unfortunately the vital capacity was taken as a way of measuring these things. Despite incredibly significant errors in both the methods and conclusions of these studies this approach spread to Europe during the second half of the 19th century and dividing study populations by race has become standard practice ever since.

When I first started doing pulmonary function testing I was taught to decrease the predicted vital capacity by 15% for Blacks and 10% for Asians. Decades later ethnicity-based population studies replaced these fractions. I always took this as the correct way to approach predicted values (and it is embedded in the ATS/ERS standards) but at the same time I’ve always had patients where it was either difficult to assign ethnicity or where their results significantly exceeded their ethnicity-based reference values. Over the last several years I have had the opportunity to study the issues surrounding reference equations extensively and I have become somewhat disenchanted with the notion of ethnicity-based reference equations.

Continue reading