OUES, a useful sub-maximal CPET indicator of maximum VO2

The primary goal of a Cardio-Pulmonary Exercise Test (CPET) is to determine an individual’s maximum oxygen consumption (VO2), minute ventilation (Ve) and heart rate (HR). An adequate CPET is usually indicated by a Respiratory Quotient (VCO2/VO2) that is greater than 1.10, a heart rate greater than 85% of predicted or a Ve greater than 85% of predicted. There are a variety of reasons why patients are unable to exercise to their maximum. Although these reasons can of course include poor motivation, factors such a musculo-skeletal limitations or concerns about patient safety due to EKG changes can cause patients have a sub-maximal test.

Assessing a sub-maximal test is problematic but there are a number of derived CPET values that have been shown to be useful indicators even when the amount of test data is limited. We have used the Ve-VCO2 slope as one of these indicators for quite a while. Ve-VCO2 slope can be calculated using the Ve and VCO2 from the entire CPET or from just the pre-anaerobic threshold data. Given that there is usually a different Ve-VCO2 slope after AT that is influenced by lactic acidosis as well as VCO2 compared to the slope before AT our preference has been to use only pre-AT data. This means that a CPET can be significantly sub-maximal and we can still get an accurate Ve-VCO2 slope.

The Ve-VCO2 slope is primarily sensitive to the match between ventilation and perfusion in the lung. There is a loose correlation between the Ve-VCO2 slope and cardiac disease and this is usually because of the pulmonary consequences of cardiac disease, not because it is necessarily sensitive to cardiac output or peripheral vascular disease.

An individual’s maximum VO2 is a significant indicator of morbidity and mortality from cardiac disease but when a CPET is sub-maximal the VO2 will be as well. The Ve-VCO2 slope does not correlate well with maximum VO2 and cannot be used as a way to estimate it. A number of investigators however, have shown that the Oxygen Uptake Efficiency Slope (OUES) strongly correlates with maximum VO2 and that OUES can be calculated from sub-maximal CPET test data.

Continue reading

An IC shows it’s probably not restriction

For the last couple of years it seems that I’ve had more problems than usual with lung volume tests. Even though this seems to date from the time that my lab went through its hardware and software upgrade and we started performing N2 washouts I suspect that these problems have been around for a long time and these events just heightened my awareness of lung volume testing problems.

My lab performs helium dilution, N2 washout and plethysmographic lung volume tests. When you are assessing the quality of lung volume tests the first problem for the helium dilution and plethysmographic techniques is whether or not the Functional Residual Capacity (FRC) was accurately measured and for N2 washout, it’s whether or not the Residual Volume (RV) was accurately measured. Leaks are always an issue for any of these measurement techniques and for helium dilution and N2 washout leaks will almost always cause the Total Lung Capacity (TLC) to be overestimated. For plethysmography the picture is less clear since leaks can cause TLC to be either over- or under-estimated.

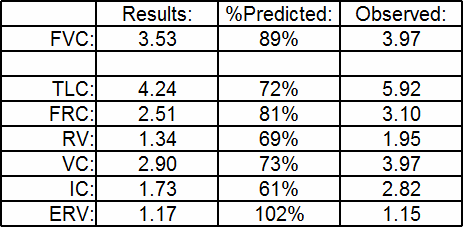
Once you accept that the initial measurement of FRC or RV is accurate, however, the next question is whether the SVC is accurate or not. Since SVC is a more relaxed test than a forced vital capacity the SVC volume should be at least the same as the FVC volume and it is often larger. When I see an SVC that is smaller than the FVC I tend to think that the calculated TLC is probably okay and it’s the RV that is more likely to be overestimated. This is because the Inspiratory Capacity (IC) part of the SVC maneuver (“take as deep breath in as you can!”) is the easiest part and when the SVC is low, it is usually because the Expiratory Reserve Volume (ERV, “blow everything out that you can!”) is underestimated.

This report came across my desk a couple of days ago. The lung volumes were performed by helium dilution.

Not_RVD_Results 

Continue reading

Measuring Thoracic Gas Compression

During exhalation air flow occurs because of the pressure difference between the alveoli and the surrounding atmosphere. The increase in alveolar pressure acts to compress the air inside the lung and because of this compression the decrease in lung volume during exhalation is always going to be greater than the volume of exhaled air. This effect is known as Thoracic Gas Compression (TGC).

The flow rate that occurs for a given alveolar pressure depends primarily on airway resistance. When an individual has airway obstruction their airway resistance is increased and they often attempt to increase their expiratory flow by increasing the amount of force they apply during exhalation. This increased force further compresses the air inside the lung and increases TGC. Numerous researchers have shown that there is usually a substantial differences in TGC between subjects with normal lungs and those with airway obstruction.

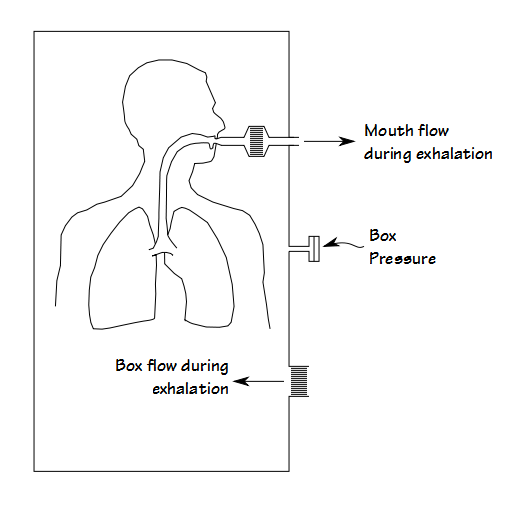
Routine spirometry and lung volume tests cannot measure thoracic gas compression. It can only be measured in a special kind of plethysmograph. Unfortunately the nomenclature for this type of plethysmograph is a bit muddy and it is variously known as a transmural, constant pressure, volume-displacement or flow plethysmograph (I prefer volume-displacement because I think this sums up its mode of operation most succinctly). In this type of plethysmograph the subject breathes in and out through an opening in the box. The expansion and contraction of their lungs causes air to flow in and out of the box through a separate opening. The pressure inside the plethysmograph is monitored and used to compensate for any delays in box flow.

Volume-displacement plethysmography

Volume-displacement plethysmography

Continue reading

It’s all about FEV1, except when it isn’t.

A number of physicians and researchers I’ve known and respected have said that in spirometry it always comes down to FEV1 since it is the primary indicator for airway obstruction. Certainly FVC and the FEV1/FVC ratio are important but because patients can stop exhaling early for any number of reasons FVC can be underestimated which in turn can cause the FEV1/FVC ratio to be overestimated so they are not quite as reliable as FEV1.

There are, of course, a number of factors that can cause FEV1 to be mis-estimated. It can be underestimated due to cough or glottal closure and it can be overestimated because of excessive back-extrapolation. Nevertheless, I think that overall the FEV1 tends to be the most accurate and reliable number obtained from spirometry.

This spirometry report came across my desk this morning: 

  Observed: % Predicted: Predicted:
FVC (L): 5.01 114% 4.39
FEV1 (L): 3.86 117% 3.30
FEV1/FVC: 77 103% 75
PEF (L/sec): 4.91 55% 8.99 

Because a reduced FEV1 is a reliable indicator of airway obstruction doesn’t that mean that a normal or as in this particular case, a slightly elevated FEV1 rules it out? Well, actually no, it doesn’t.

Continue reading